Simulation or the question “What if?”
If you look up the meaning of the word “simulation” in the German Duden, the first entry is the explanation “to pretend” – i.e. “to act as if”. However, if you read on, simulation can have a different meaning: imitation. It stands for “what if?”. It is about reproducing processes and facts on the basis of models or imitating them realistically. For centuries, complex phenomena have been described by models in the sciences. Simulations enable us to understand important aspects of the systems described in this way, to predict changes and to decide how to control such systems.
Visualizations transform data from computer simulations into graphic representations. Using these images, the information from the simulations can be interpreted and analyzed easier. Visualizations illustrate the simulation results.
What is a model? What is a simulation?
Simulations are created on the basis of models. In this way, different scenarios can be simulated which are too expensive or too dangerous in reality or which are not visible to the naked eye. Simulations make the invisible visible.
Example from the field of biology:
Model: Virtual reproduction of the human brain
Simulation: How does the brain behave when taking certain medication? In this way, the transport of medications can be made visible.
Simulations make processes visible.
Vivid examples can be found in the simulation gallery.
Credits: University of Stuttgart / SFB 1313
Bone cement spreading during vertebroplasty
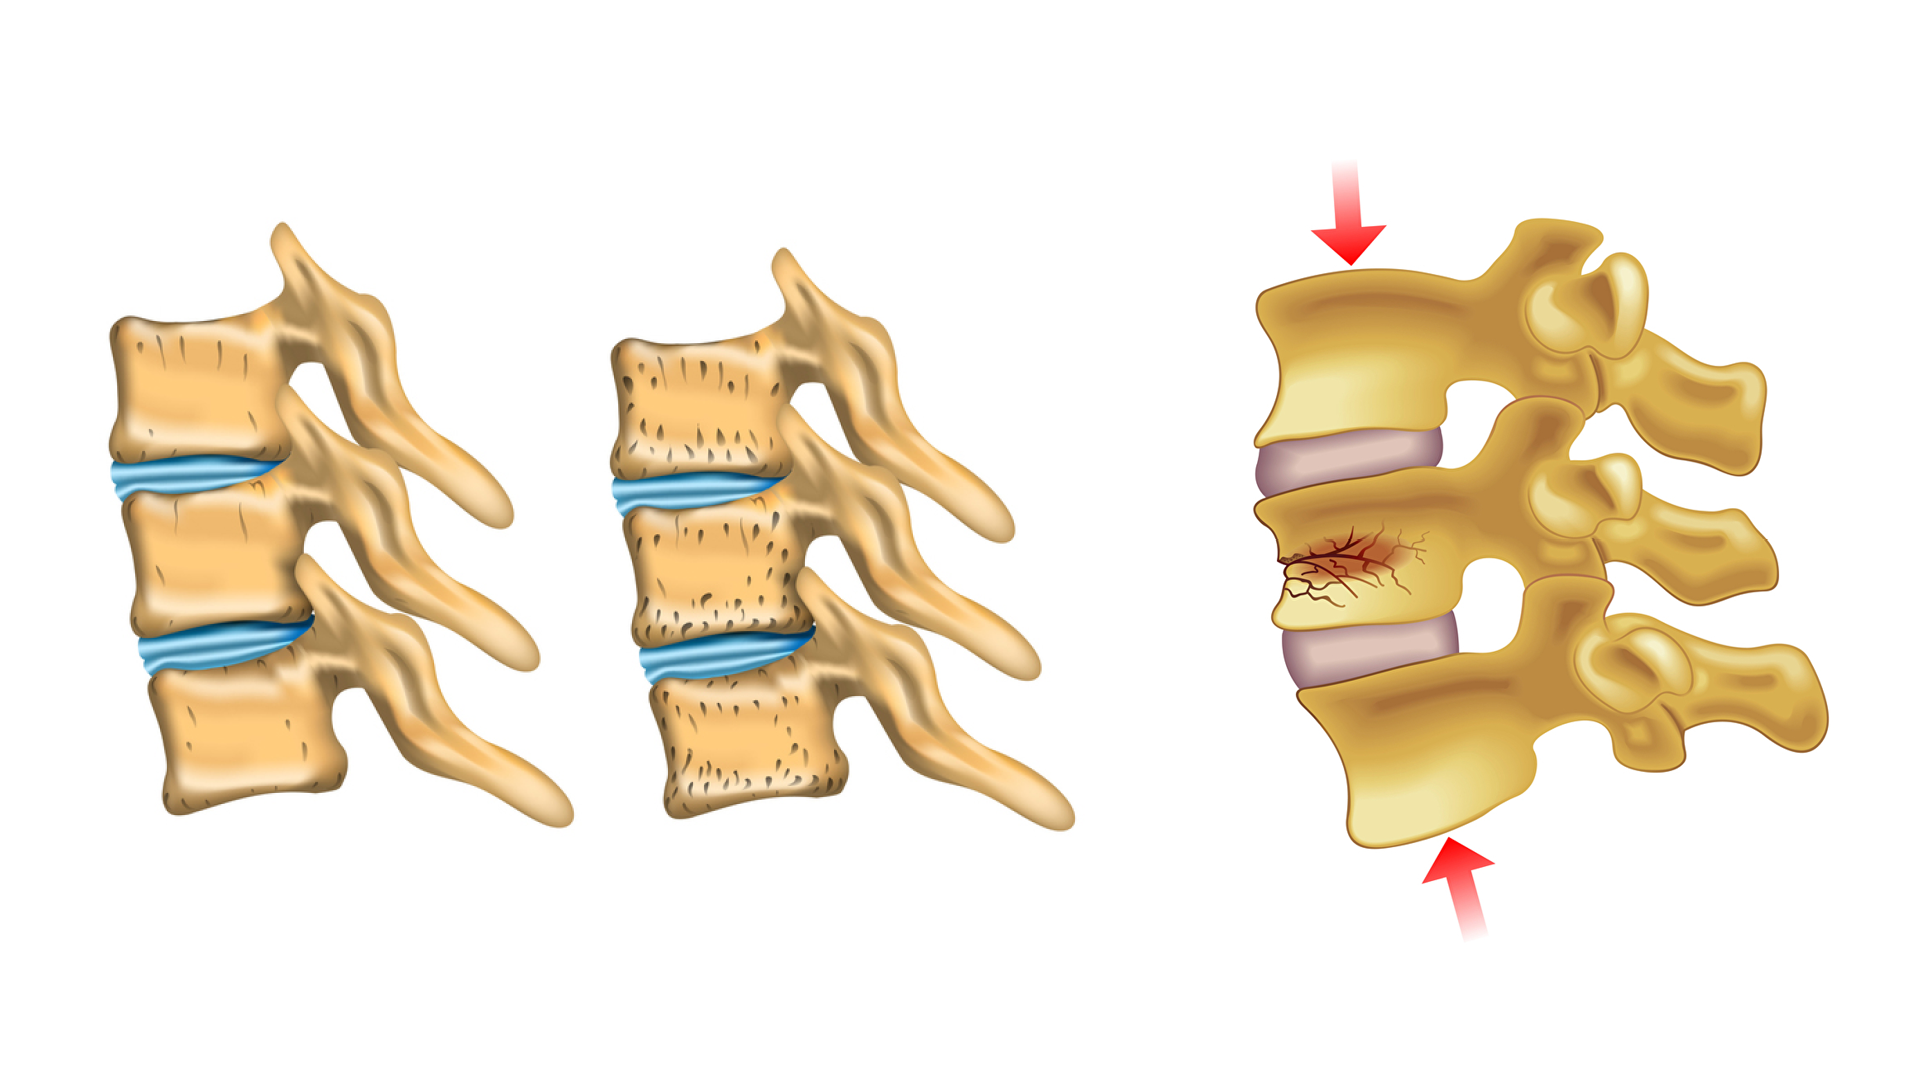
The human skeleton goes through a lifelong process called bone tissue remodelling, in which mature bone tissue is removed and replaced by newly formed tissue. If this process is no longer in equilibrium and bone tissue does not grow in sufficient quantities, it will lead to bone shrinkage and a decrease of bone density. This disease, which often occurs in old age, is called osteoporosis and can lead to massive restrictions in the stability of the entire skeleton and can be associated with a greatly increased risk of bone fractures. In the area of the spine, the weakening of the bone structure can lead to sintered fractures in the vertebral bodies and to serious complaints from those affected. Vertebroplasty is a therapeutic treatment to stabilize osteoporotic vertebral bodies and represents a minimally invasive operation, in which so-called bone cement is injected percutaneously into the vertebral body and stabilizes it again after the previously liquid bone cement has hardened. During the treatment, particular care must be taken to ensure that no injection material emerges from the vertebral body. Possible serious consequences caused by cement leakage are an embolism or a compressing of the spinal cord.
Eine Therapiemaßnahme zur Stabilisierung von osteoporotischen Wirbelkörpern ist die Vertebroplastie. Dies ist eine minimalinvasive Operation, bei welcher sogenannter Knochenzement in den Wirbelkörper perkutan injiziert wird und diesen nach dem Aushärten des zuvor flüssigen Knochenzements wieder festigt. Bei der Operation muss insbesondere darauf geachtet werden, dass kein Injektionsmaterial aus dem Wirbelkörper austritt. Mögliche schwerwiegende Folgen einer solchen Zementleckage sind etwa das Verursachen einer Embolie oder die Kompression des Rückenmarks.
The numerical simulation of vertebroplasty can help to avoid complications during the procedure and to make predictions about the spreading of the bone cement within the vertebral body. The main goal here is to optimize the process of treatment by testing factors such as the position of the injection needle, the choice of bone cement and the necessary injection pressure in preoperative simulations. On the one hand, this gives surgeons the opportunity to assess risks in advance and, on the other hand, to achieve the best possible therapy result. Another goal in simulating vertebroplasty is to gain a deeper understanding of the forces and pressures that arise within the vertebral body during bone cement injection. This enables predictions to be made as to whether the trabecular bone structure is deformed or destroyed by the resulting stresses caused by the injection.
The employed continuum mechanical model is based on the Theory of Porous Media (TPM) and relies on the formulation of constitutive relations for the solid skeleton of the bone, the injected bone cement and the bone marrow, which fills the bone at the beginning. This enables the direct consideration of important parameters such as the bone cement viscosity and the anisotropic permeability of the bone structure in the vertebra. The resulting system of equations is solved in a fully coupled manner and allows the simultaneous investigation of the injection process and the spreading of the bone cement with the associated displacement of the bone marrow and the resulting stresses and deformations within the bone structure.
Credits: University of Stuttgart / Christian Bleiler
Credits: University of Stuttgart / SFB 1313
Credits: Utrecht University
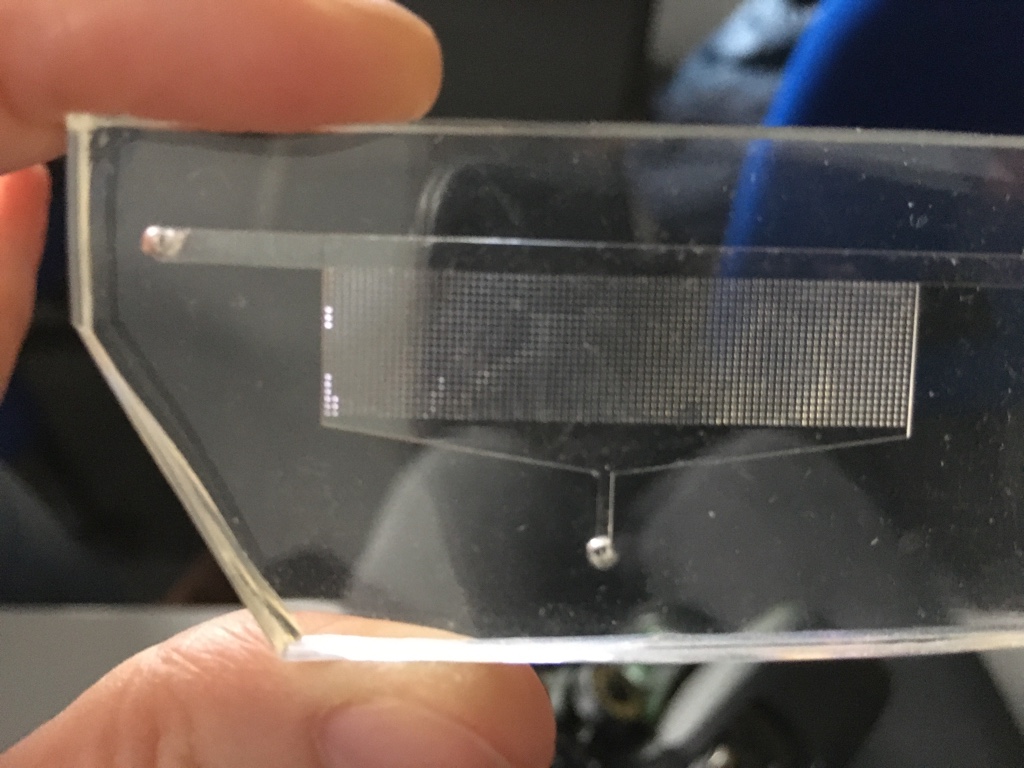
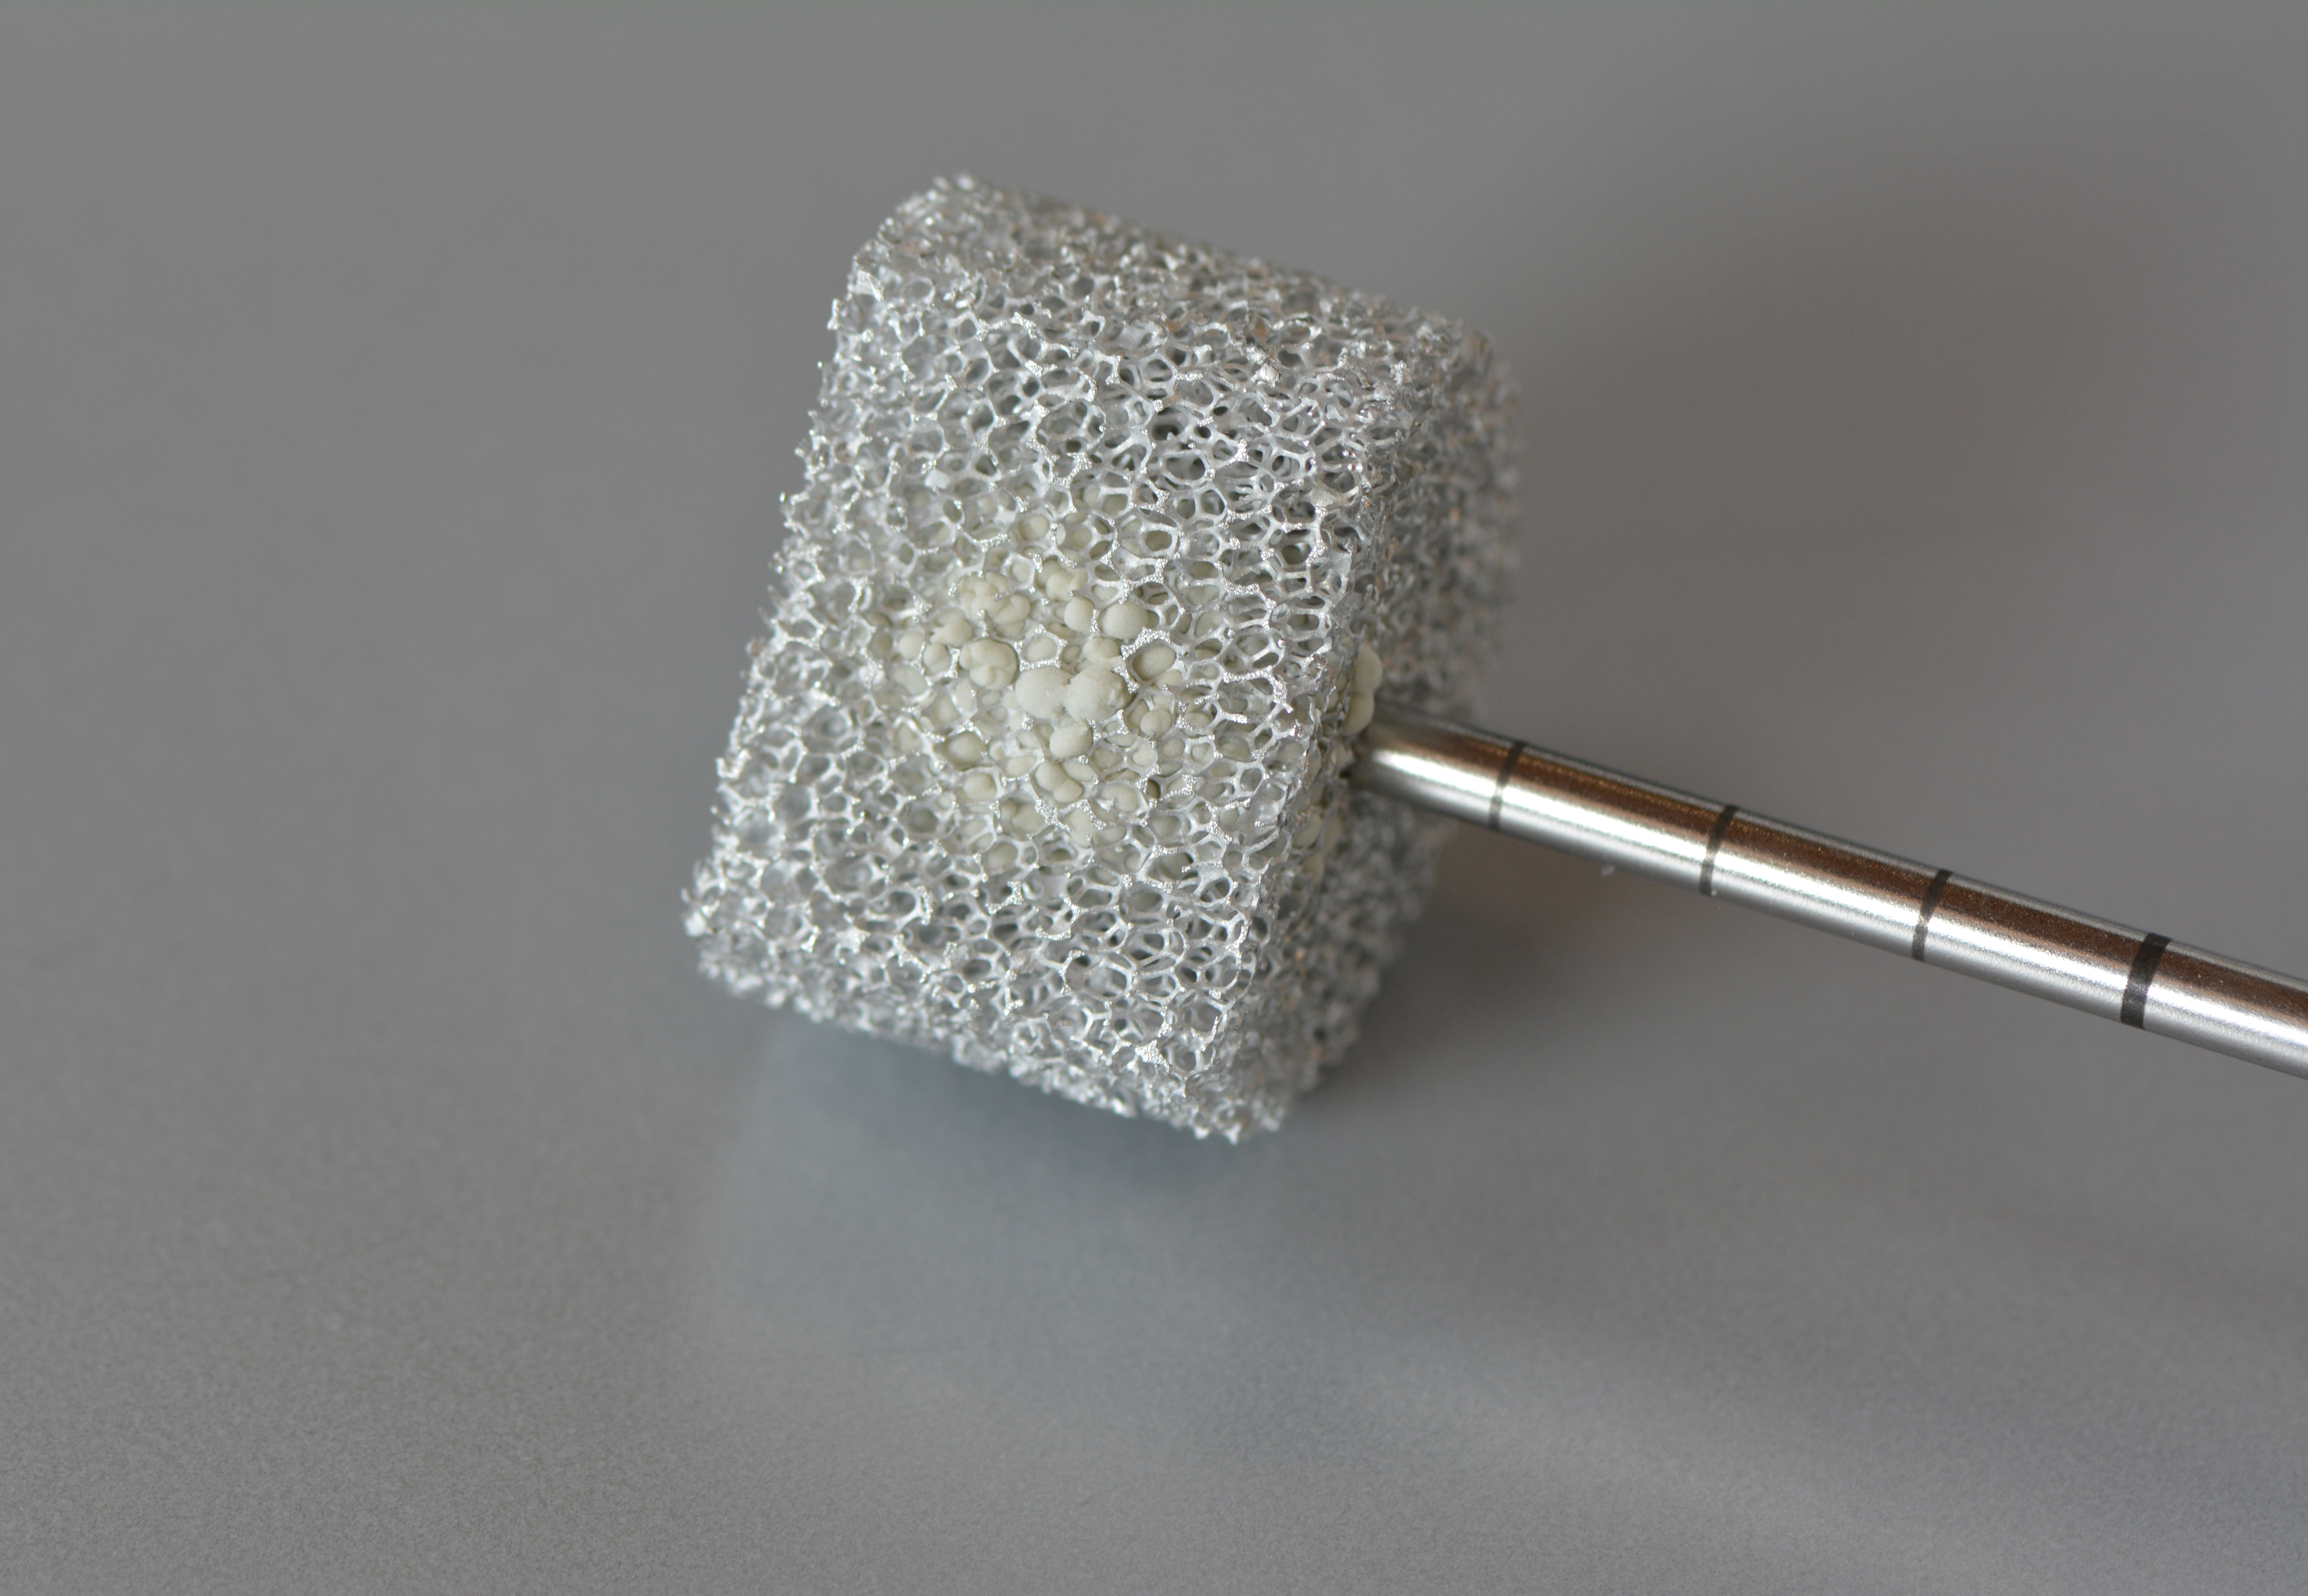
This is a model of a porous structure made of silicone (1). Researchers can conduct different lab experiments with this model.
A liquid can be made to flow through this model. Analogous experiments (2) are often very expensive. Laboratory experiments generate data, which in turn can be used for virtual experiments (models and simulations). Simulations can be repeated as often as required without incurring enormous costs.
Credits: University of Stuttgart / SFB 1313
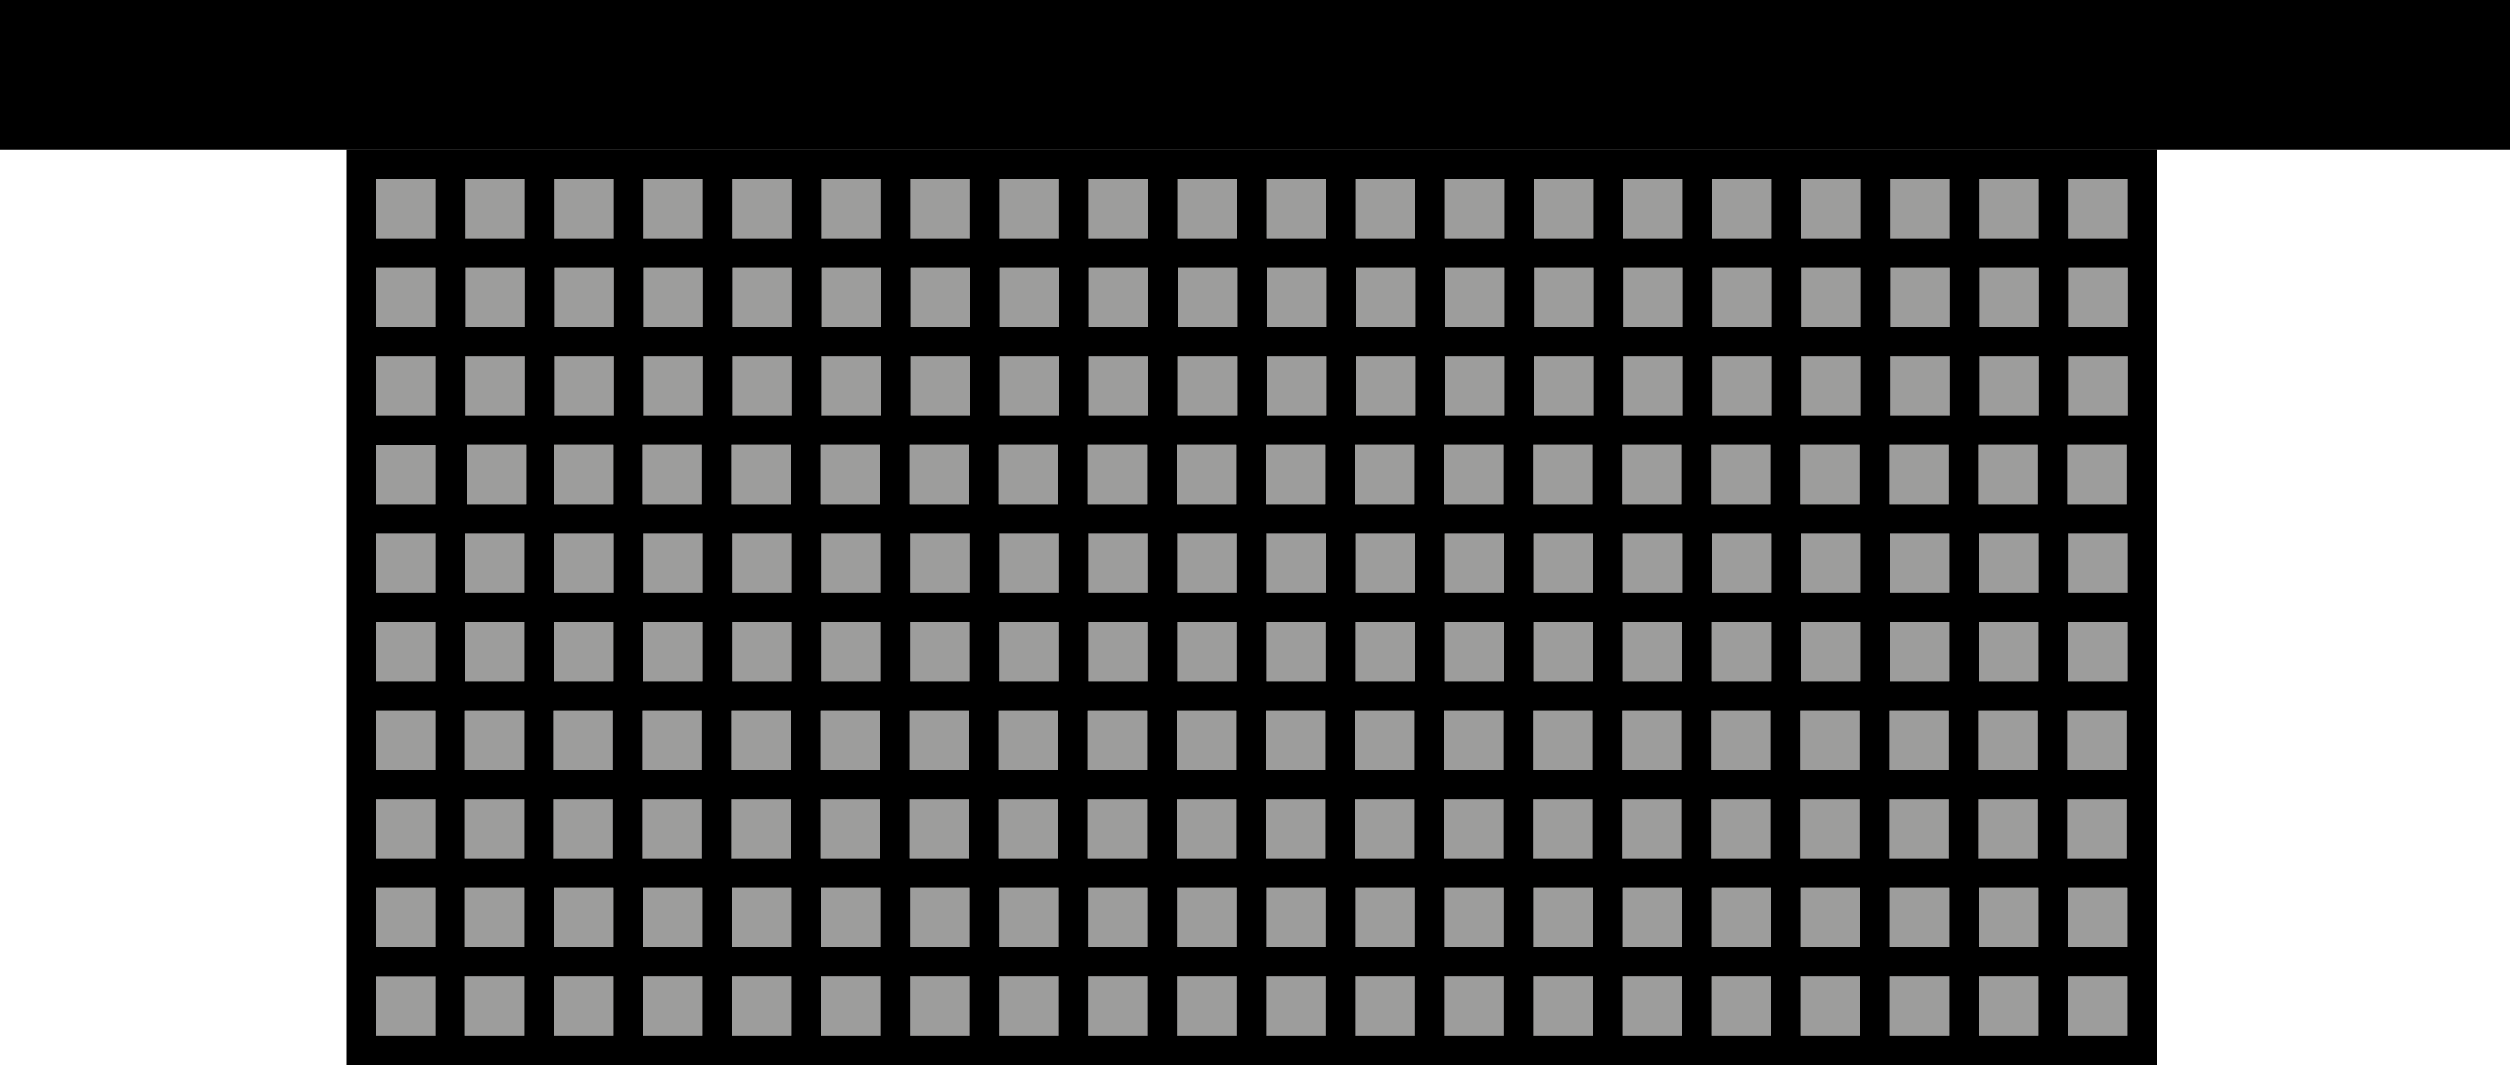
This is a simplified model of a porous structure from the analog experiment, which was reconstructed on the computer with special modeling software. The grey squares illustrate the solids. The black background illustrates the interfaces – the pores.
Researchers can conduct virtual experiments – simulations –with the help of this computer model. For that, they use the data acquired from the analog experiment. The simulations help to examine whether the experimental data from the analogue experiments are correct.
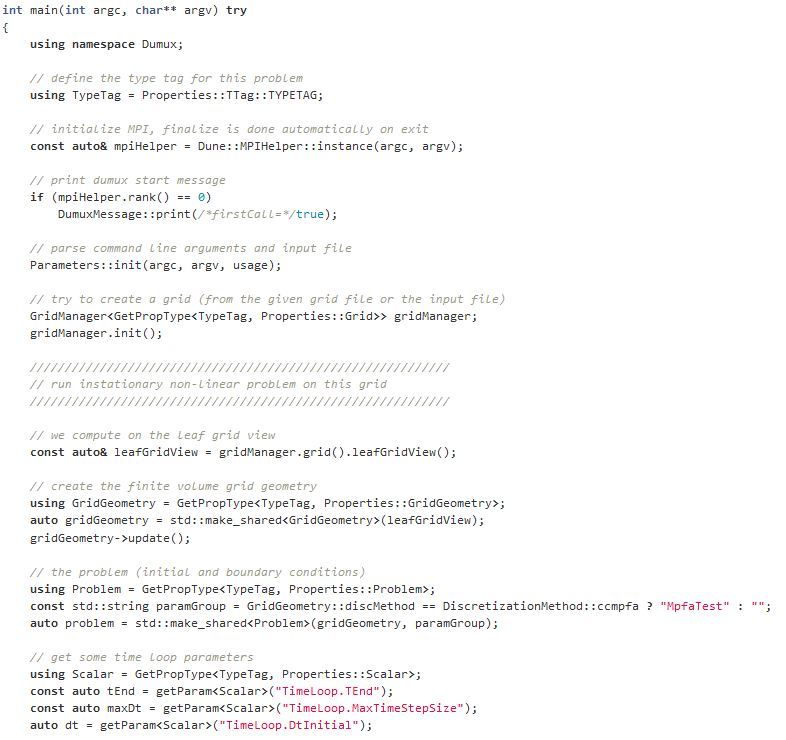
What is source code?
Source code is text written in programming language, which is structured in lines.
The text consists of different components, which are applied to formulate commands. A simulation is built with the help of the source code. The source code is important because it alone is responsible for how a simulation looks like and for the content. If only a single character is set incorrectly, the simulation is affected and becomes erroneous.
Credits: University of Stuttgart / LH2
Credits: University of Stuttgart / LH2
Credits: University of Stuttgart / LH2
What is DuMuX?
DuMuX is a software (= compute program), with which models can be programmed. On the basis of these models, simulations can be performed.
DuMuX means “DUNE for Multi-{Phase, Component, Scale, Physics, …} flow and transport in porous media”.)
DuMuX is a open source software that has been developed at the University of Stuttgart.
What is an open source software?
Software, public for the public, is called open source software. That means that the source code is freely accessible. In this way existing knowledge can be easily transferred and exchanged with others.
Other examples of open source software or computer programs are Firefox, Google Chrome, Linux or Open Office.

Credits: PantherMedia / bakhtiarzein
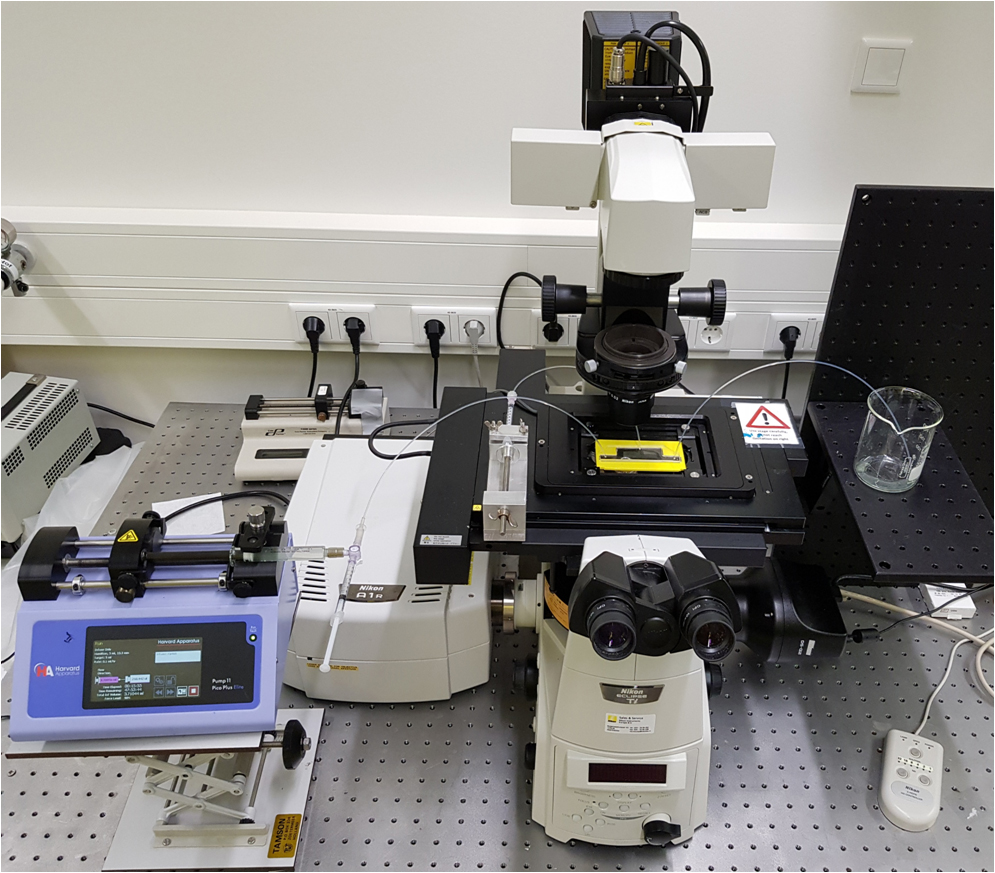
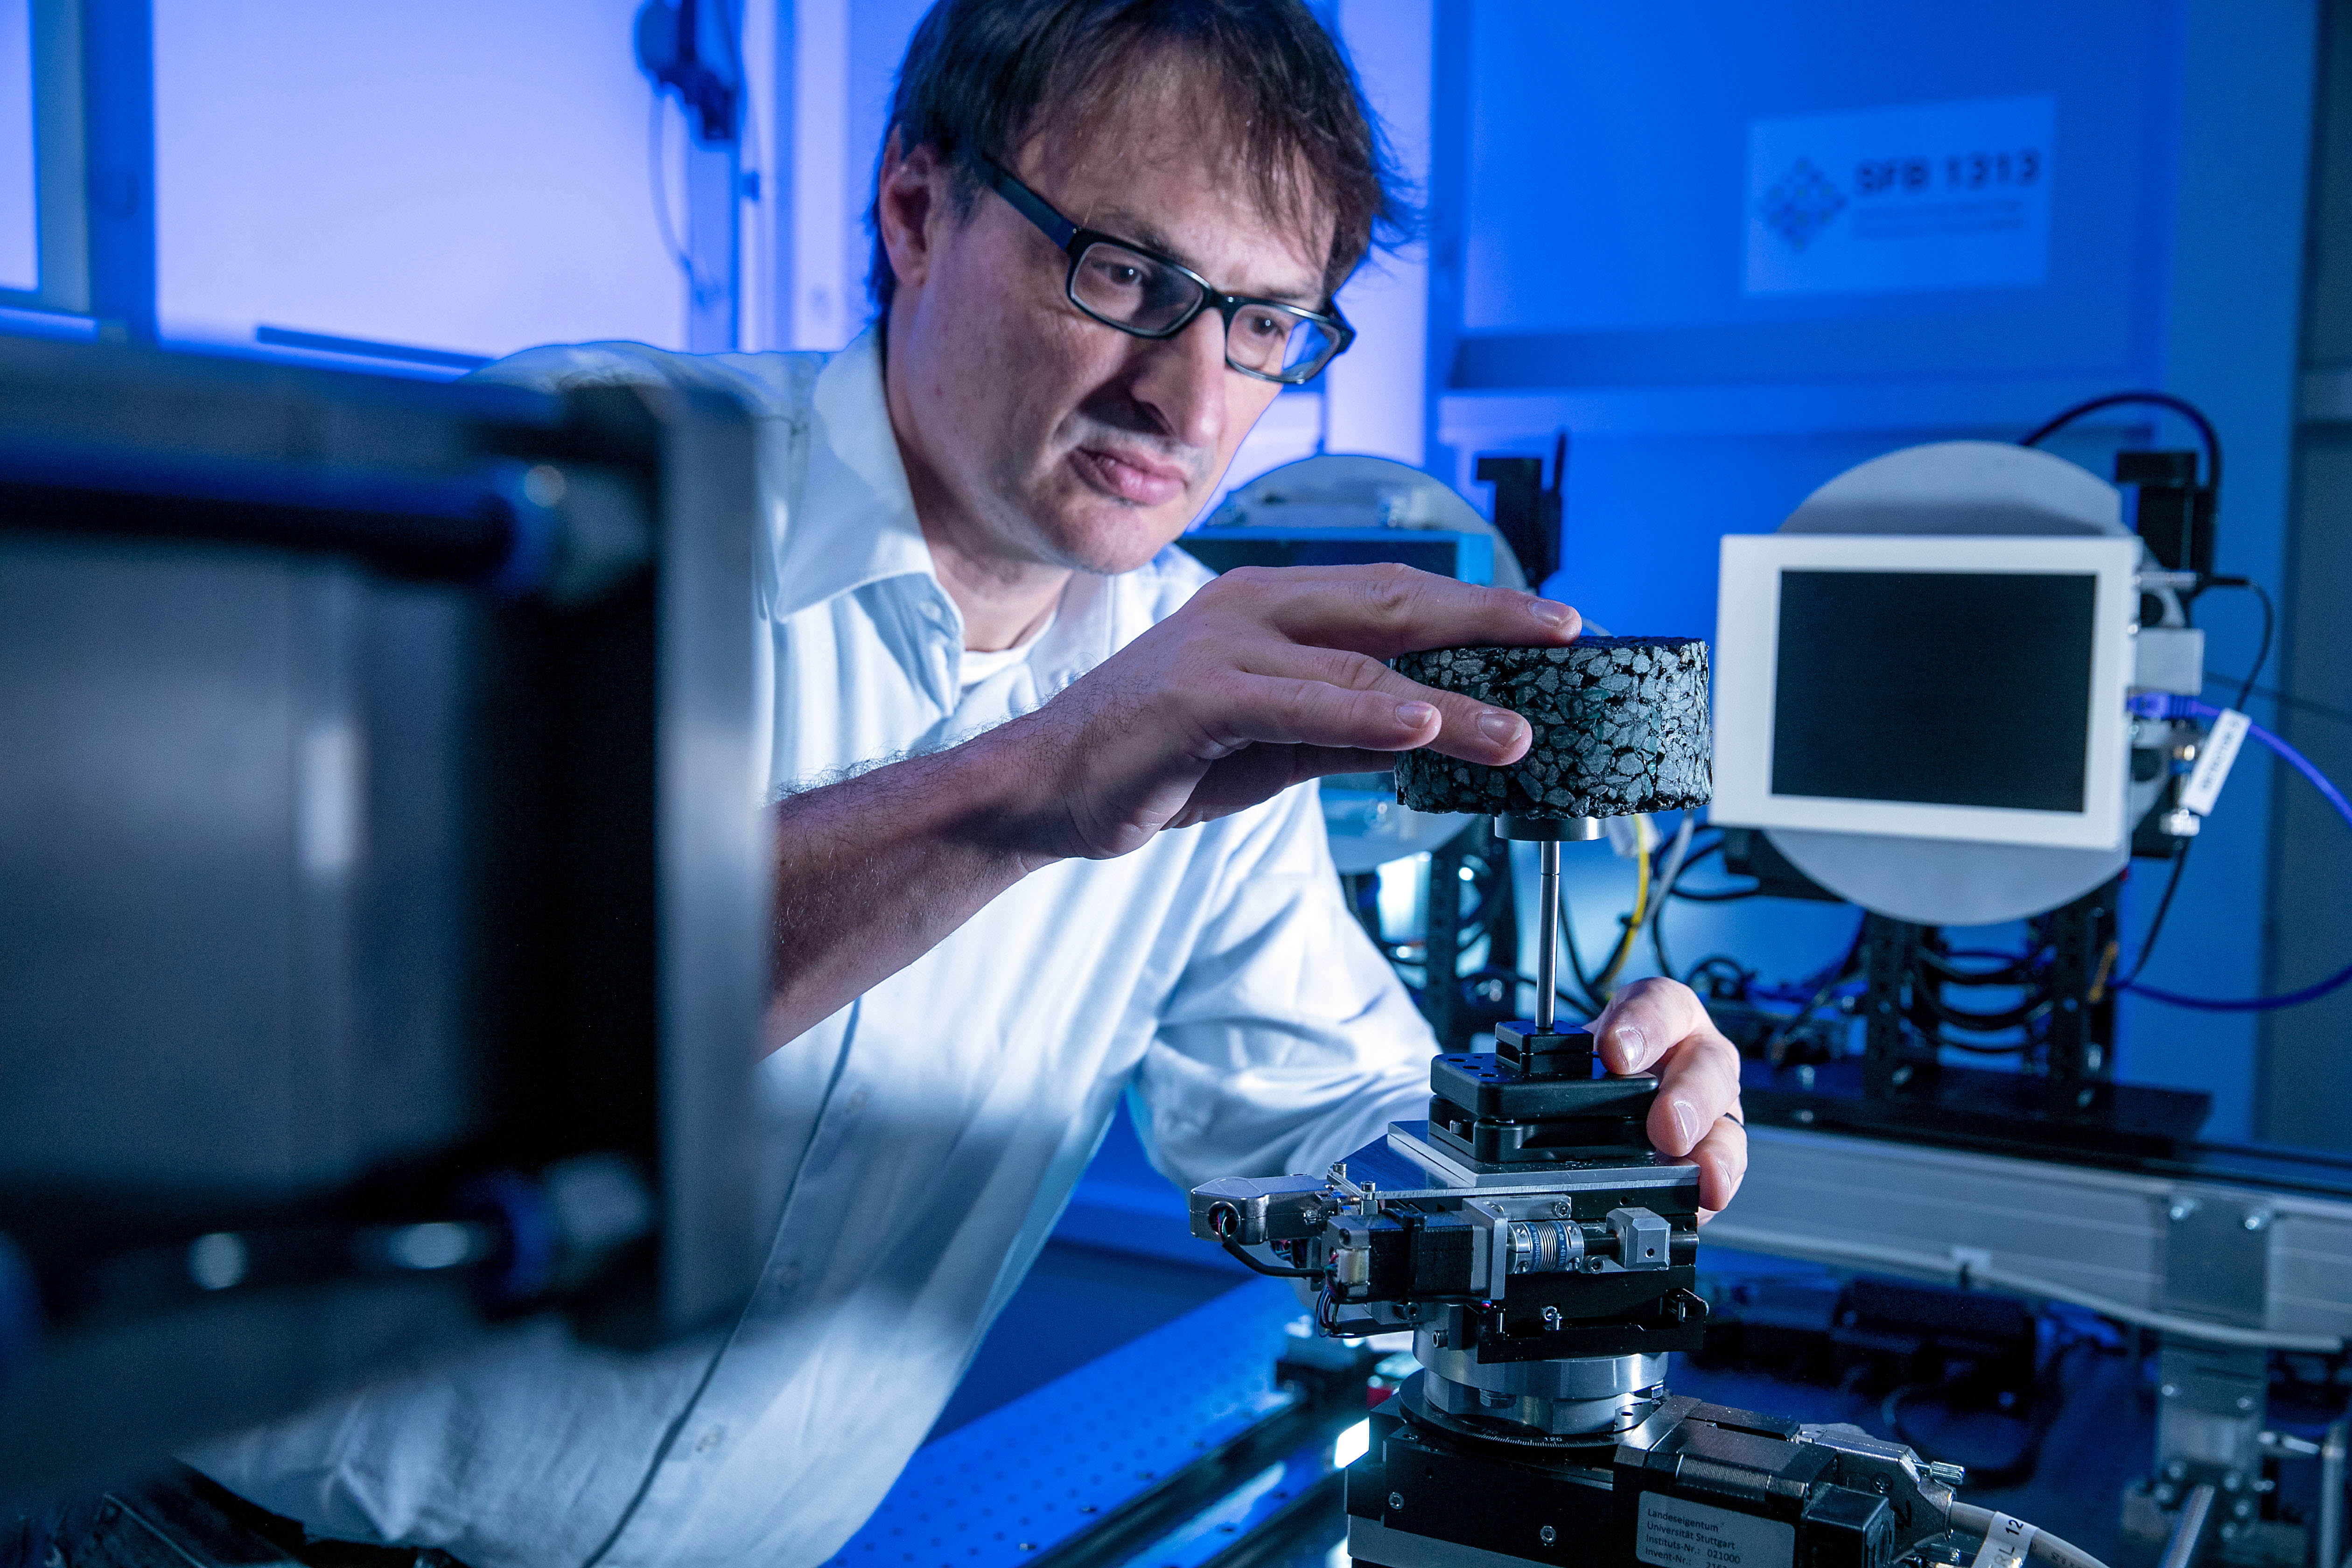
Holger Steeb, Professor at the University of Stuttgart and Principal Investigator within SFB 1313 (the Collaborative Research Center on porous media), and the Cluster of Excellence SimTech, gives us an insight into experimenting with porous media. He and his team show us, how important experiments are to better understand hydro-mechanical properties of porous materials in order to develop mathematical models, which can be used in simulations and for technical applications. In the “Porous Media Lab” the team is aiming to make porous media transparent by using high resolution x-ray computer tomography. Based on CT-scans, the pore space can be visualized, characterized and segmented for subsequent direct numerical simulations.
From the experiment to the simulation: How the “porous medium” asphalt becomes visible
Credits: Universität Stuttgart / Uli Regenscheit
Credits: University of Stuttgart / Holger Steeb
Do we have holes in asphalt? “Holes“ are also denoted as “pores” by porous media scientists. The effective material properties of asphalt and further porous materials strongly depend on the properties of these pores. Unfortunately, we are not able to classify the pore space as e.g. asphalt is an intransparent material. Therefore, trying to answer the question about “holes in asphalt” anyway, we are using X-Ray Computed Tomography, a technique widely used in medicine, to make asphalt transparent and to characterize the pore space. Afterwards, high-resolution 3D CT-scans are for us the image-based sources for further investigations, i.e. multi-scale simulations for the determination of effective physical properties of porous media.
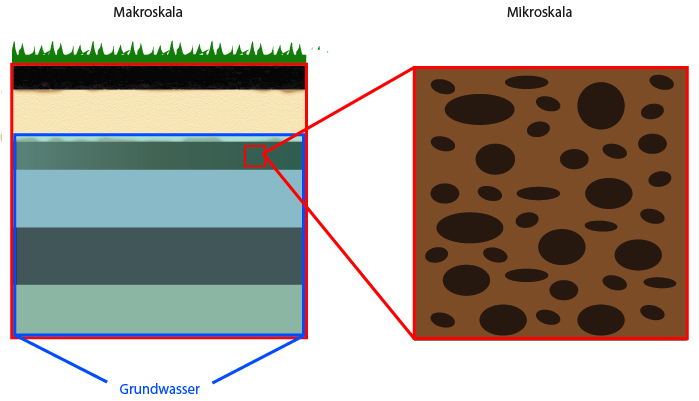
If we examine different objects or materials from the “outside,” the porous structure they have in common is often not visible to us. We have to zoom into them with a microscope to be able to distinguish the solids and the void spaces between them. There are different scales on which porous media can be examined more closely.
There is a distinction between the micro and macro scale.
Micro scale: this is the insight view, i.e. a zoom into the porous medium. In this way, the porous structure and pore geometry as well as the distribution of the fluid and solid phases become visible. Problems that can be described on the microscale are very small.
Macro scale: the macro scale (also called Darcy scale or REV scale) uses averaged “views” by defining properties that correspond to micro-scale effects.
Credits: University of Stuttgart / SFB 1313
Porous media research happens on different scales. They can be explained with the help of the example of “soils”.
If we look at an earth pile under the microscope, we can see that the individual grains of earth lie on top of each other, next to each other or below each other. The grains build the porous structure. The grains are the “solids”, and the void space between the solids is the “pore space”. This pore space is permeable and liquids and gases can easily flow through it.
The micro scale can be digitally recreated. To that end, researchers create a model that corresponds to the reality. With this model different scenarios can now be carried out.
When people talk about simulations today, they are usually computer simulations. Here, processes or objects are simulated by the computer and reality is reconstructed virtually. By abstraction, a model is created, on which experiments are carried out. In such digital experiments, individual parameters, possible effects and effects under different influences can be tested virtually. In this way, we can also look back into the past or reach unreachable areas.
But it is not possible to do entirely without experiments, because sometimes simulations provide several different explanations for one phenomenon. Thanks to simulations, however, experiments are much more targeted in these cases.
Computer simulations are the third pillar of science, alongside experiments and theory. They help scientists to recognize connections, uncover gaps in knowledge and understand processes.
Simulations are an important tool for many disciplines. Whether it is meteorology, medicine, mechanical engineering, physics and chemistry, forestry and agriculture, sports science, environmental technology, engineering science or materials research – progress today is hardly conceivable without simulations. However, simulations do not only play an important role in science and technology, but are also becoming increasingly important in business, politics and the social sciences.
Simulations are used when…
![]()
… a system is very large or very small.
Due to the size of the universe, experiments can often only be carried out at great expense. Simulations are also often used on a small scale – in the field of atoms and molecules.
![]()
…experiments are too expensive.
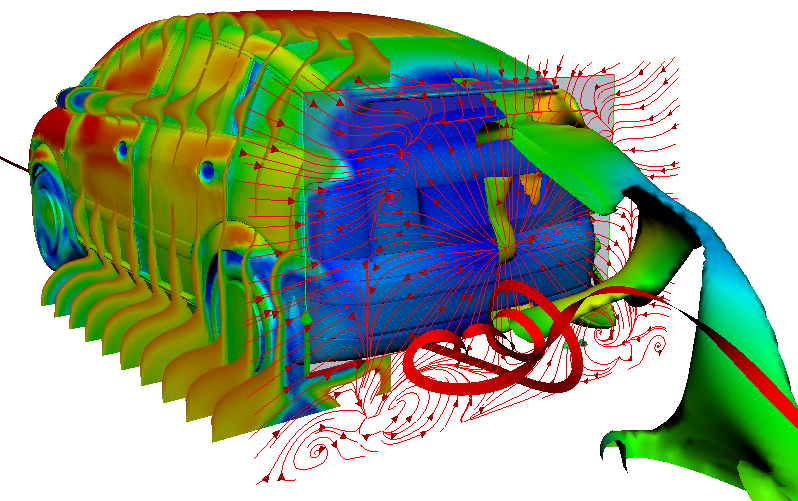
Real tests, for example on the behaviour of machines, are very expensive and time-consuming. Crash test simulations save resources and a lot of effort, because in reality fewer cars have to be destroyed.
![]()
…experiments are too dangerous.
Some experiments are far too dangerous in reality. These include, for example, experiments on core meltdown or on processes in our environment such as the storage of CO2 in the soil, so-called CO2 sequestration.
![]()
…experiments are ethically unacceptable.
In some areas, experiments are prohibited for ethical reasons, for example in medicine or because they endanger others. This is why pilots in their training first train virtually on flight simulators before they actually fly.
![]()
… the system does not yet exist in reality.
Simulations also provide predictions about systems that do not yet exist. For example, the properties of new materials can be simulated before they are produced in the laboratory.
![]()
… processes run very fast or slow.
For example, when galaxies form or die, it takes many millions of years. The explosion of a supernova, on the other hand, happen very quickly. In computer simulation, you can virtually adjust the time.

In which application areas do we use simulations?
Driving and flight simulator | weather forecast | climate simulations | crash tests | simulation of production plants | spread of drugs in the body | spread of tumors in the body | simulation of geological processes | product development | automobile development | big bang | explosion behaviour | development of materials | election forecasts | risk analyses | company analyses | population trends | effects of money market instruments | forecasts in the insurance industry | simulation of political reform plans | simulation of global capital and commodity flows in stock trading | simulation of historical events | development of prostheses | …
Which disciplines use simulations?
Bioengineering | Food chemistry | chemistry | genetics | disease research | nanotechnology | diagnostics | biology | biotechnology | sports science | pharmaceutics | medical technology | machine learning | AI | mechanical engineering | mechatronics | electrical engineering | space technology | media technology | construction | civil engineering | architecture | automotive engineering | history | linguistics | physics | mathematics | computer science | astronomy | landscape ecology | geodesy | climate research | geology | sustainability studies | renewable energies | hydrology | water management | process engineering | …
And this is how it works!
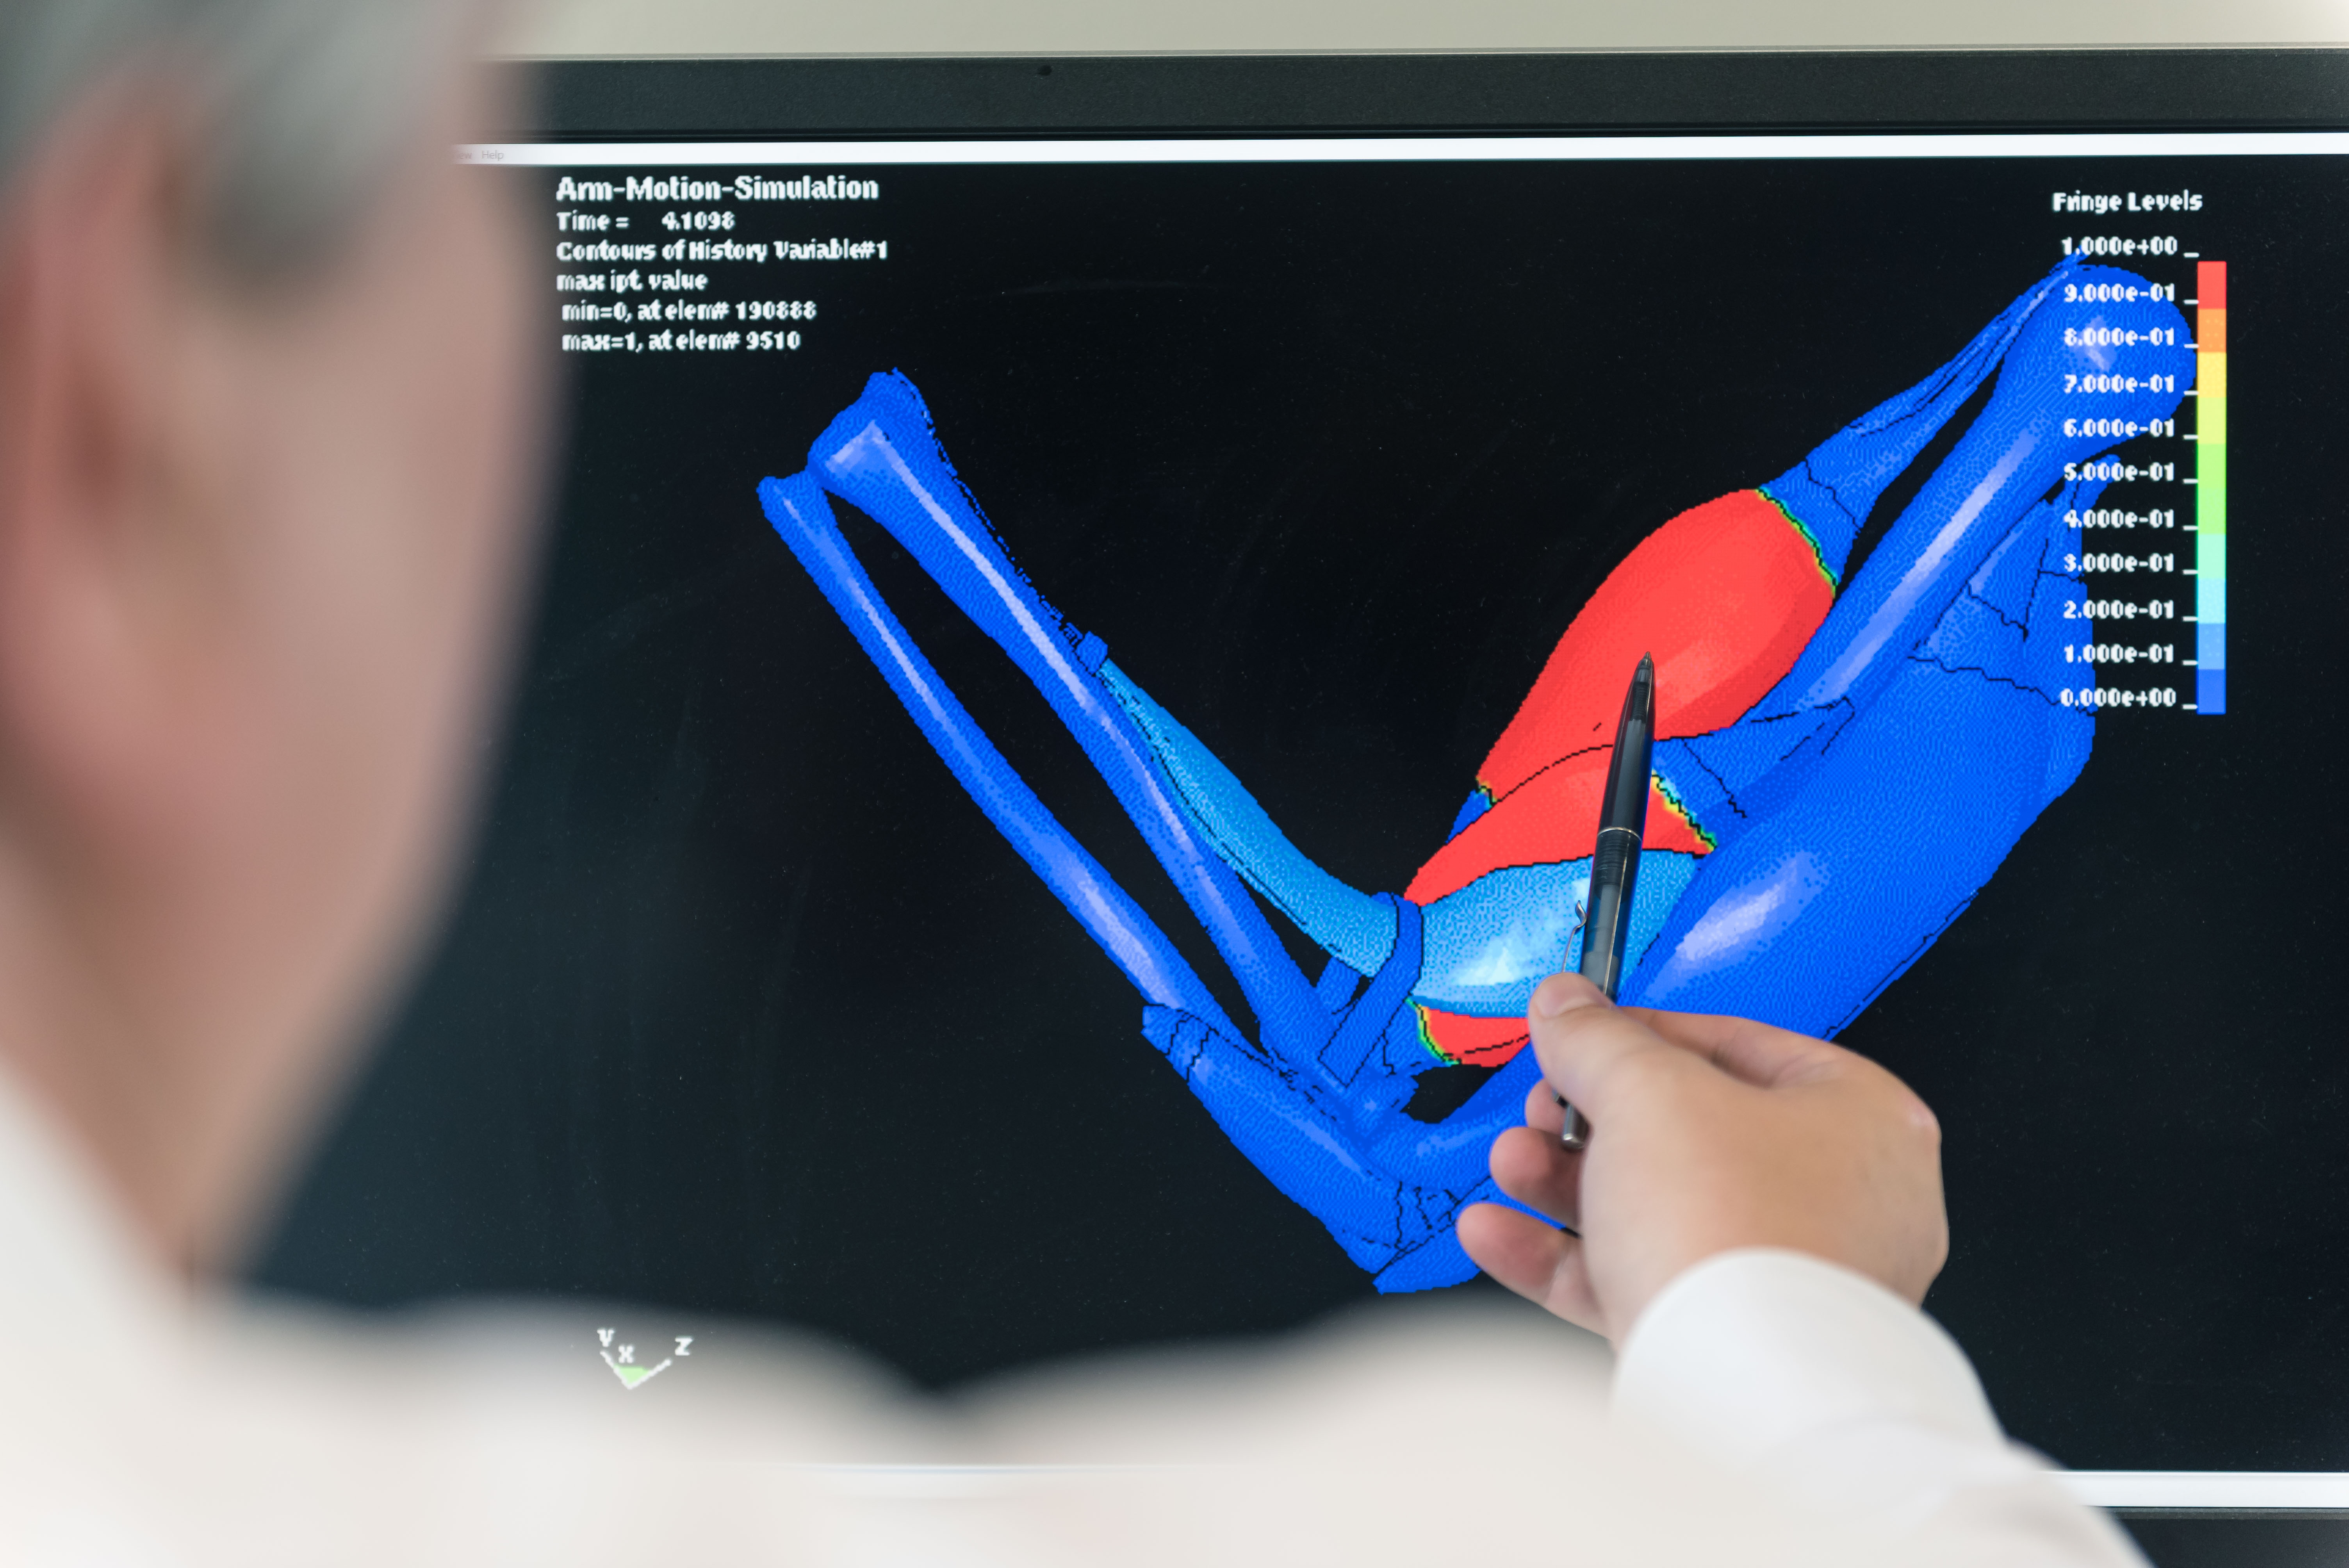
Explaining simulations using the example of the human gait
Credits: SimTech / Storz Medienfabrik GmbH
Real process
The human gait is a complex process. This becomes particularly clear when a human being loses the ability to walk. In order for this ability to be restored, for example through highly developed prostheses, researchers need to gain a better understanding of how the gait works. This is where simulations help.
Modeling
Determine the structures and influences involved. Formulation of interactions. Creation of a mathematical model.
Numerics
Inserting concrete values into the formulas of the mathematical model. Translating the model into algorithms.
Implementation
Developing a software for the simulation in order to calculate it on the computer.
Visualization
Visualize abstract simulation results and data
Analysis
Evaluation of the simulation results and comparison with the real experiment
Reality check
Do the simulation results match the reality?
Model adjustment
Incorporation of the findings into the process and improvement of the computer simulation

Credits: University of Stuttgart / SFB 1313 / Stefan Scheller / Kilian Weishaupt and Utrecht University / Matthijs De Winter
This video shows the results of a simulation which was processed with the help of data visualization. With the help of simulations, different situations can be simulated, which cannot be repeated or varied in the laboratory due to limitations on time and costs. This simulation shows how liquid flows through the porous medium. It moves in a streamlined way around the grey solid squares and flows from left to right.
The experts in the area of simulations
Who are we?
Credits: SimTech / Storz Medienfabrik GmbH
The Cluster of Excellence „Data-Integrated Simulation Science” at the University of Stuttgart has been in existence since 1st January 2019. It is funded by the German Research Foundation (DFG) within the framework of the German excellence strategy until 2026. In our Cluster, which is by the way one of two Clusters of Excellence at the University of Stuttgart, around 150 people from seven faculties of the University work together in interdisciplinary research teams. At the same time, we also take care of the next generation of young scientists within our study program Simulation Technology, our competition PlaNeT SimTech and our graduate school GS SimTech.
What do we do?
Our work focuses on the integration of simulation and data science. This means that we use the ever-increasing amount of data from various sources for our simulations from the very beginning in order to improve their accuracy. This enables us to make our models more reliable and thus make predictions that are more accurate. Scientific fundamentals are always taken into account. The knowledge gained in this way can be used in almost all areas: simulation of the musculoskeletal system, development of prostheses, development of materials, effects of geothermal drilling, development of patient-specific drugs – to name only a few.
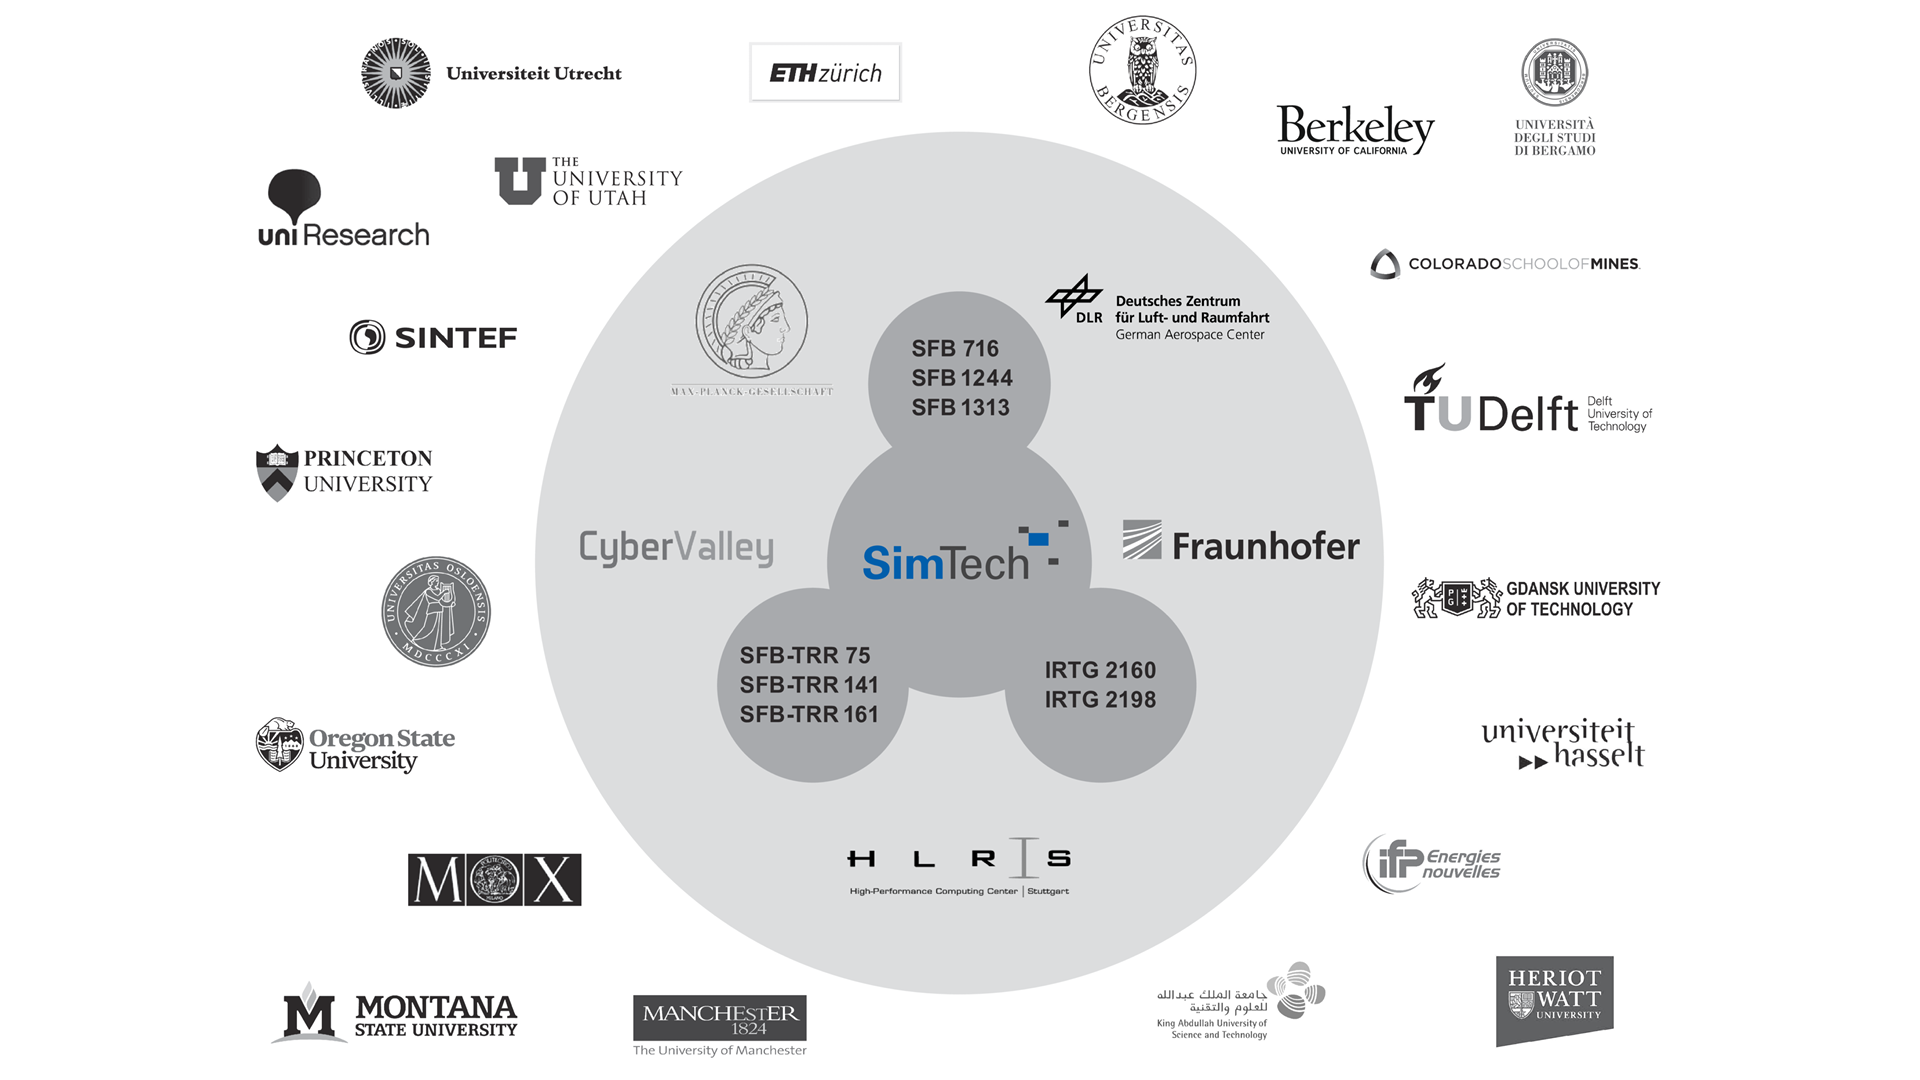
For this purpose, the exchange and cooperation with other national and international research institutions and industry are very important.
SimTech-Research
Credits: SimTech / Storz Medienfabrik GmbH
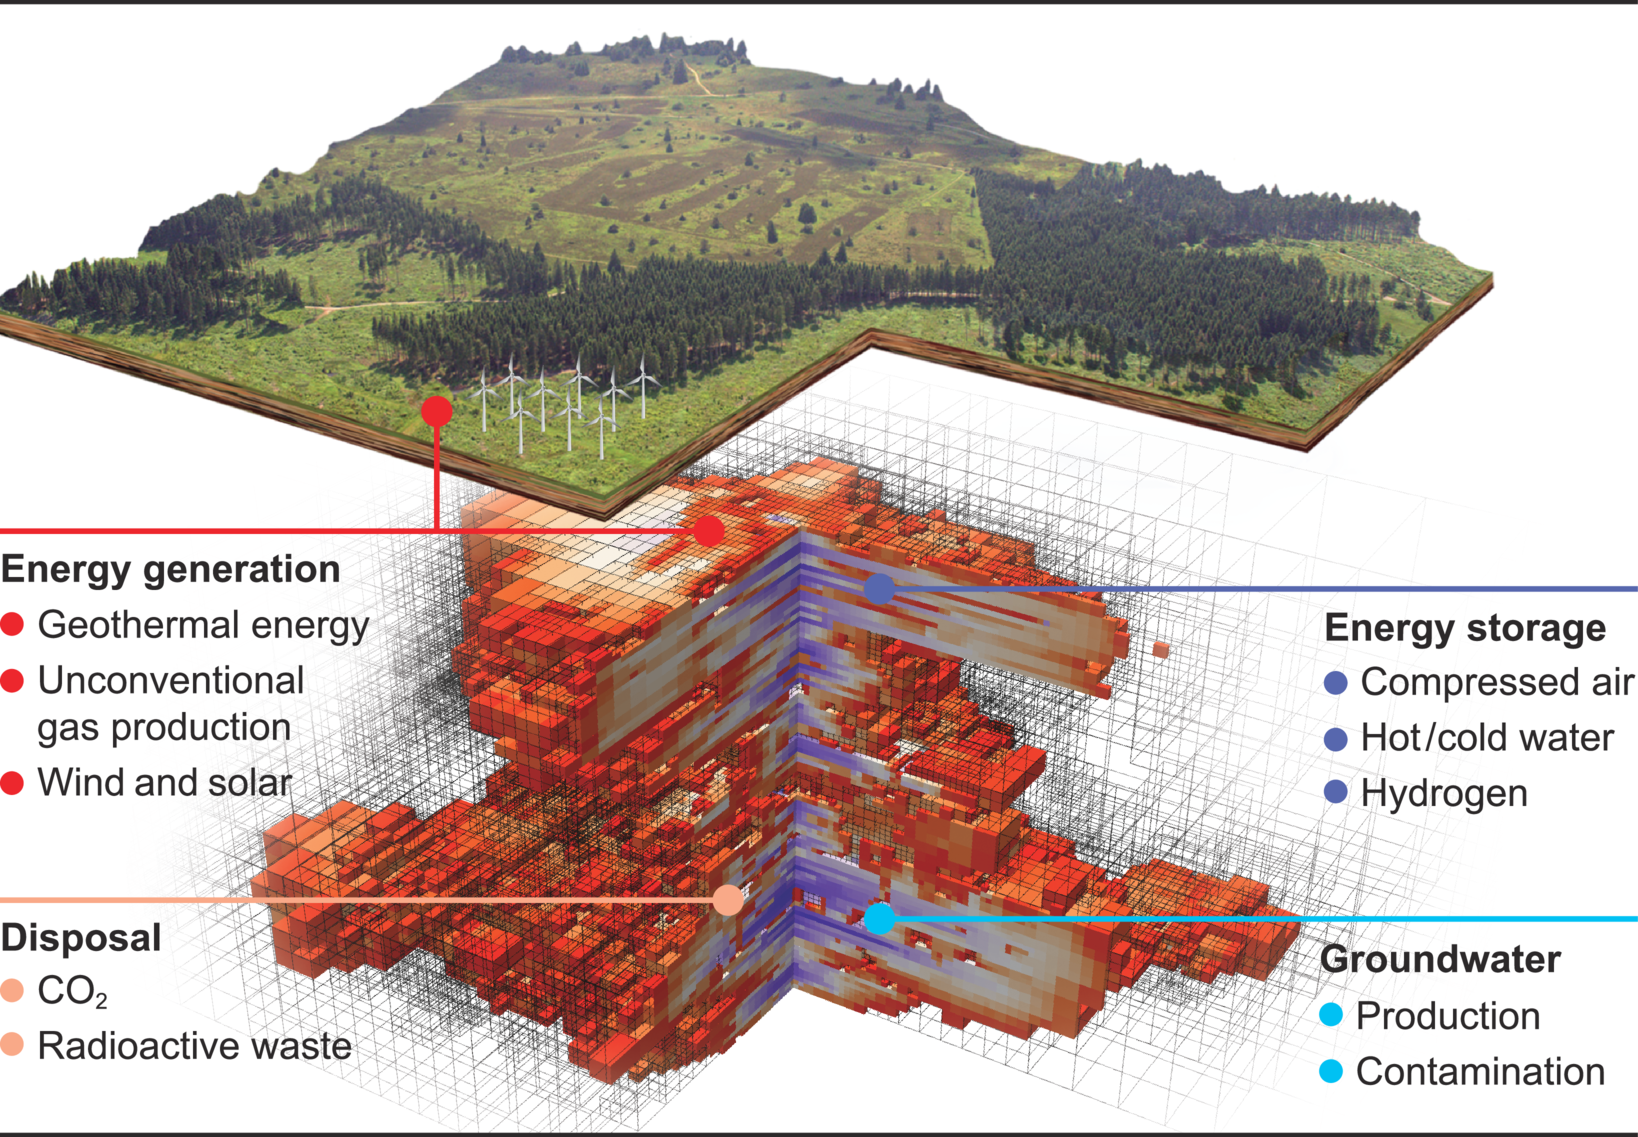
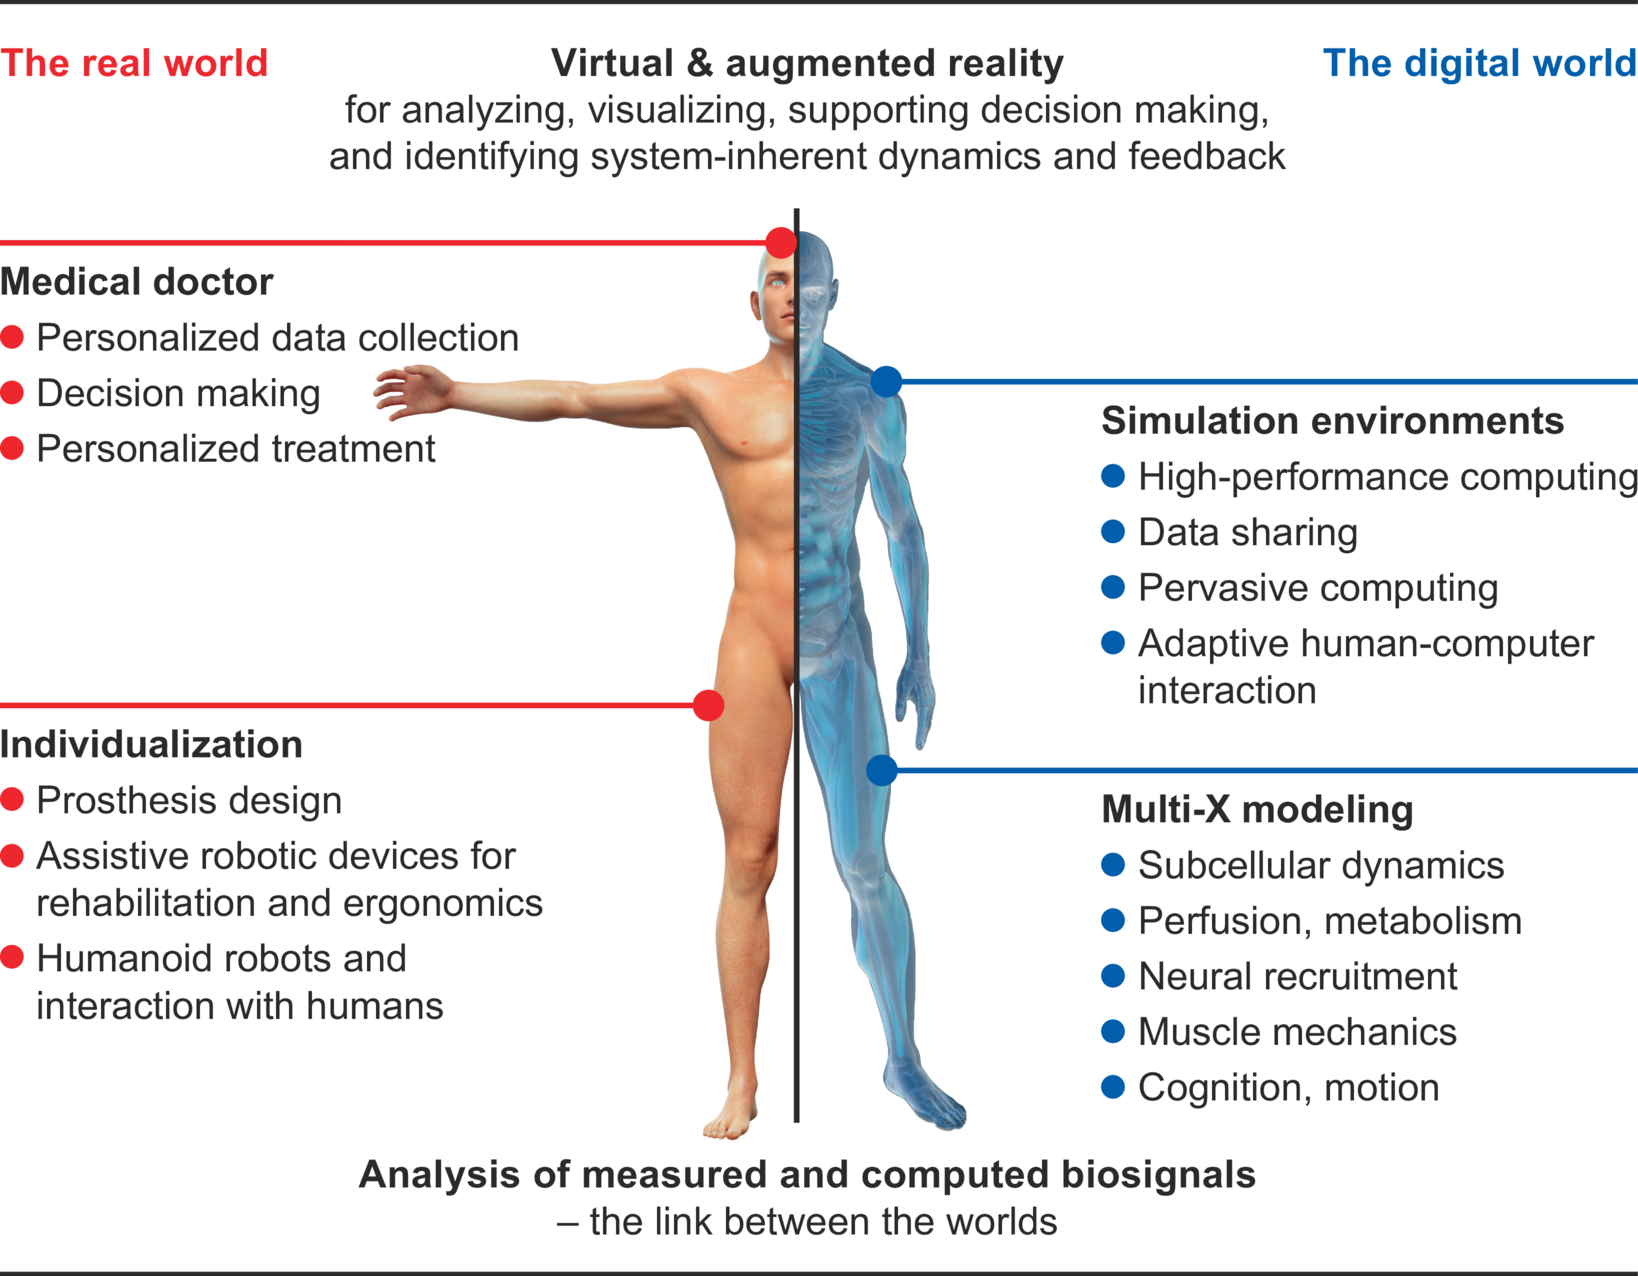
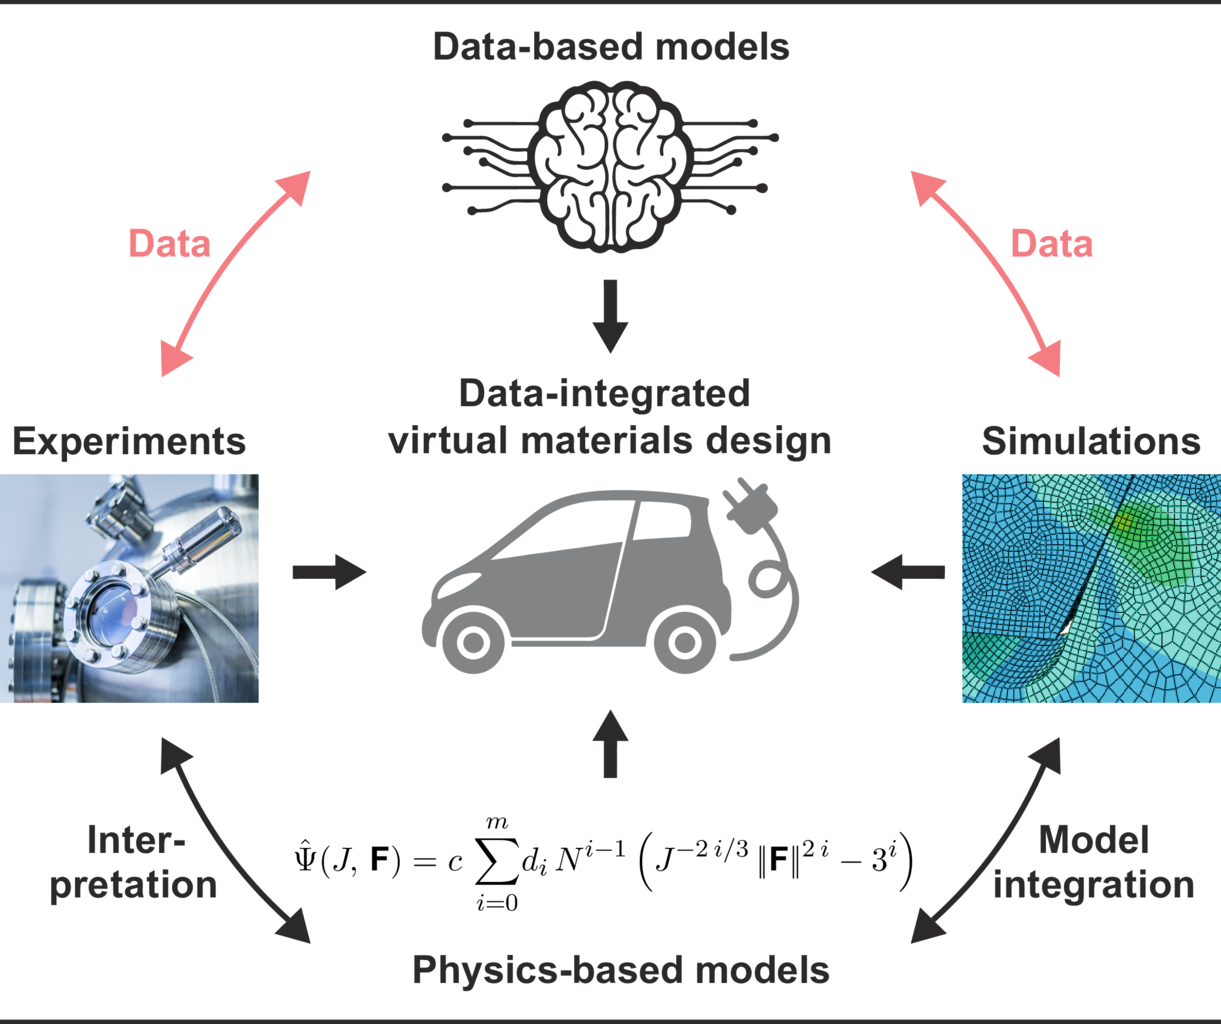
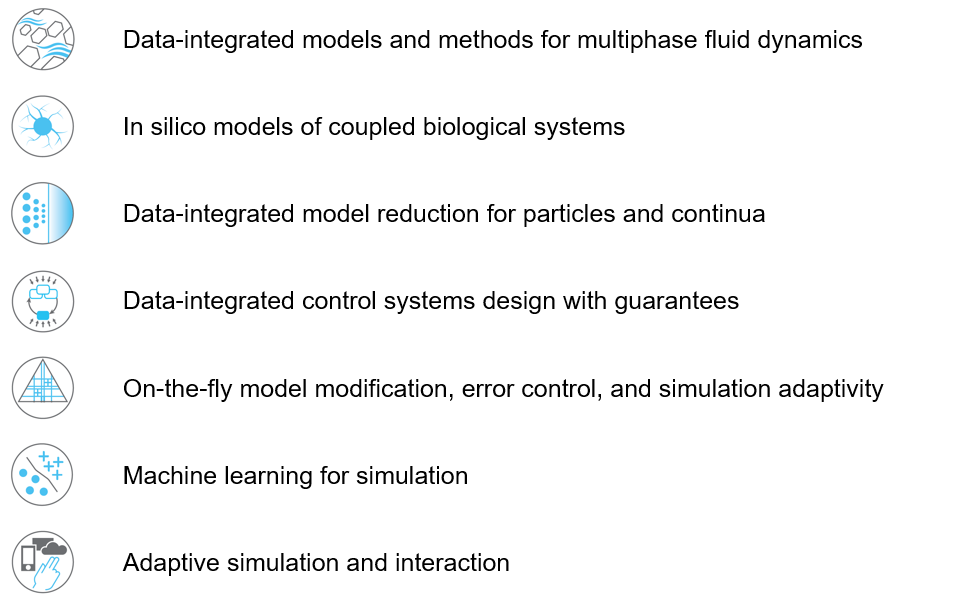
We conduct research in the field of simulation and data science. It is based on three so called “Visionaly Examples”: Engineered Geosystems, Digital Human Model and Virtual Materials Design. In order to turn these visions into reality, it is necessary to develop basic methods that can be applied to all areas and are thus are applicable across visions.
Our research is organized in interdisciplinary project networks.
Credits: University of Stuttgart / SimTech
Credits: University of Stuttgart / SimTech
Credits: University of Stuttgart / SimTech
Credits: SimTech / VISUELL
Study Program „Simulation Technology“
The interdisciplinary study program „Simulation Technology“ combines the fields of mathematics, engineering, computer science and natural science. Since 2010, students have been able to study the six-semester Bachelor’s course and since 2013 they have been able to continue their studies in the consecutive Master’s course. An excellent basis for a subsequent doctorate. Perhaps even in the GS SimTech, our graduate school.
Student competition Planet Simtech
Since 2015, the SimTech Junior Academy has been organising the PlaNeT SimTech school competition. Solving problems from natural sciences and technology is the motto here. The competition is for those students who are in their last two years of high school and enjoy mathematics, puzzles, engineering problems and tinkering. The team that finds the best solution for our modelling challenging task, such as “How much fuel do you need for a manned Mars mission?” can win up to 500 EUR.
Simulation gallery
1: Root water uptake by young, growing root systems
This simulation shows the growing root systems of two young plants. The plants take up water from the soil in a plant pot. The soil eventually dries out.
Model: soil and root
Simulation: water transport and root growth
Roots are visualized by brown tube segments. Blue soil corresponds to high water content, brown soil means low water content.
In-depth text
Credits: University of Stuttgart / Timo Koch
Credits: University of Stuttgart / Timo Koch
2: Flow through rock with fractures
This simulation shows the pressure-induced flow of oil through a cylindrical rock sample, in which elliptical fractures are contained. The pressure changes caused by the injection lead to the dilation of the fractures.
Model: porous rock and fractures
Simulation: flow and deformation
The rock is depicted in gray, and the blue region shows until which point the oil has been transported through the sample. The arrows show the velocities of oil within the sample and the deformation of the sample is strongly exaggerated in this visualization.
In-depth text
Credits: University of Stuttgart / Dennis Gläser
3: Contrast agent perfusion in capillaries and embedding tissue
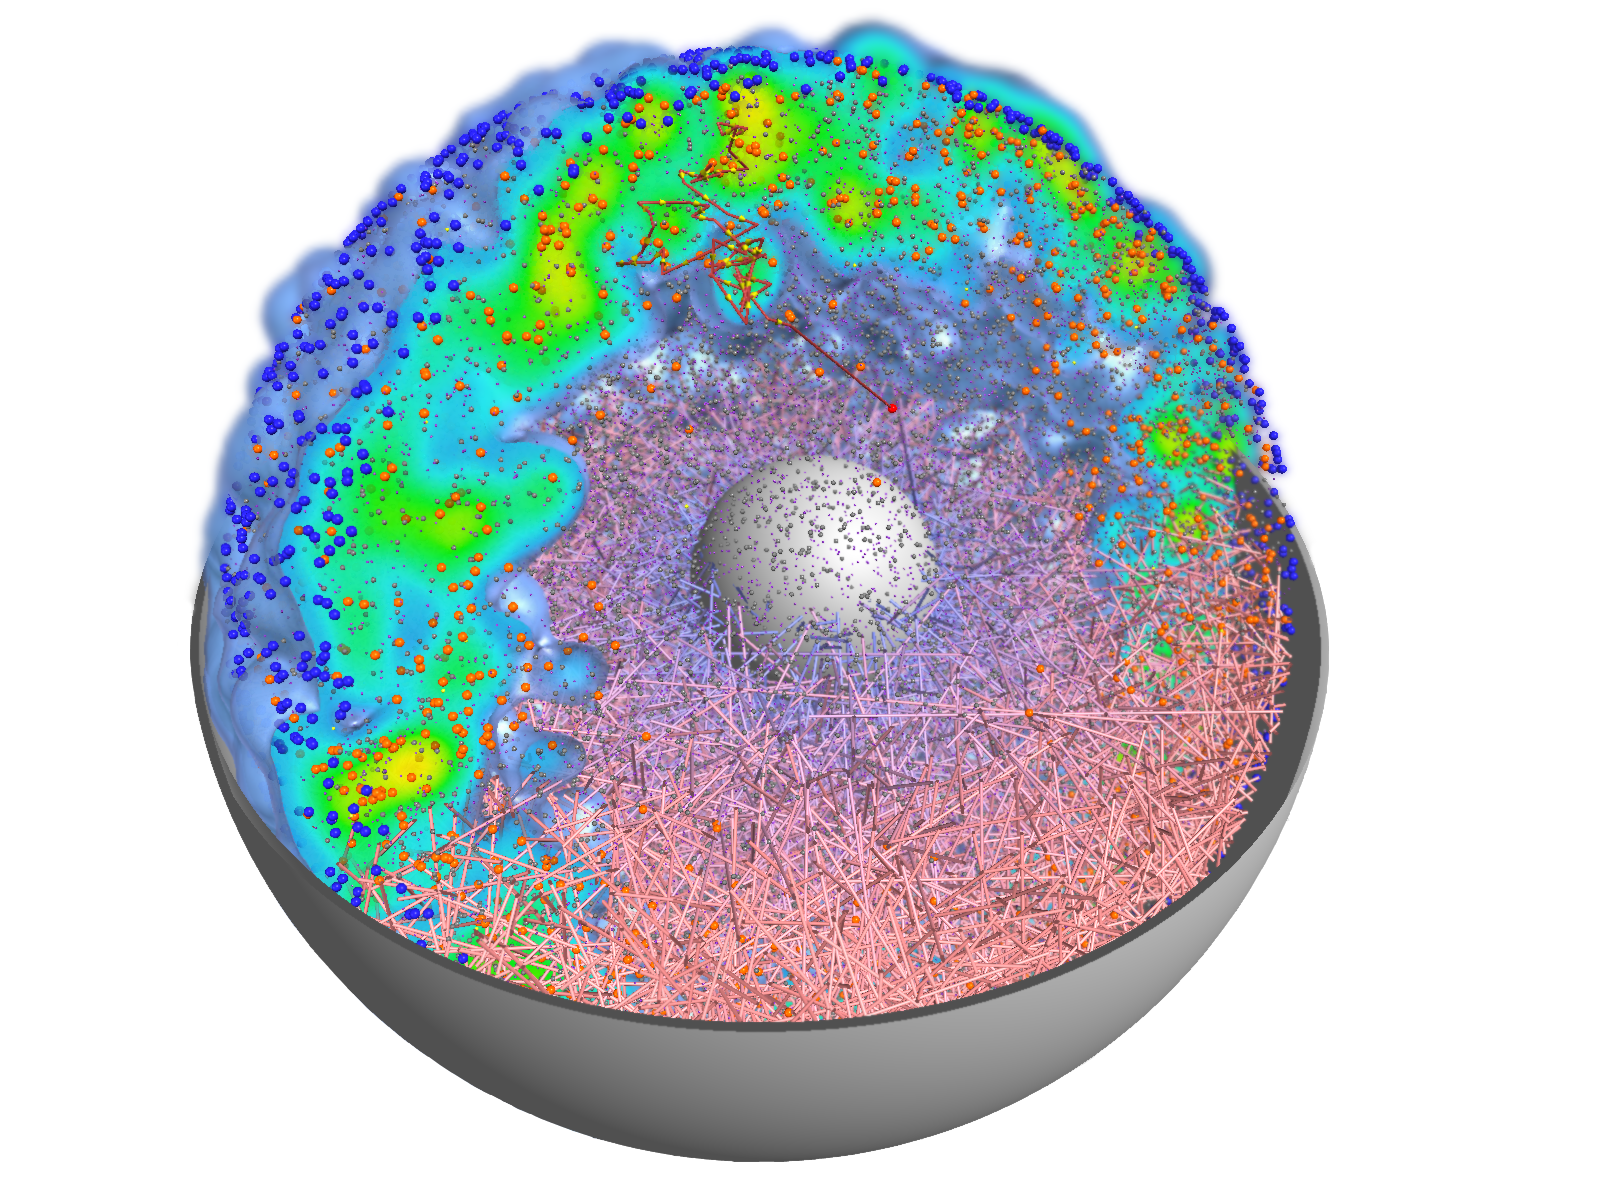
This simulation shows contrast agent transport in the smallest blood vessels (microcirculation). Blood is simplified as a fluid without particles. The cell content is accounted for by an increased flow resistance. The porous tissue surrounding the blood vessels is described by an average description. This means that individual pores between cells are not visible.
Model: brain tissue and capillaries
Simulation: blood flow and contrast agent transport
The capillary network is taken from a rat brain and represents all blood vessels contained in a 1mm by 1mm by 2mm tissue sample. The contrast agent is visualized as a black cloud. Contrast agent leakage is restricted to the middle of the domain. Leaked contrast agent has orange color.
In-depth text
Credits: Timo Koch, University of Stuttgart
Credits: Timo Koch, University of Stuttgart
About a third of the earth’s surface is covered by land. More than a third of the land surface is agricultural area (pastures, acreage) and one third is covered by forests. Plants and crops substantially influence the nutrient balance in near-surface soil layer (in the ‘vadose zone’). They play a crucial role for the local water budget and water exchange between soil and atmosphere. Water transpires—particularly during the day with the help of the sun—from small vents in the plant’s leaves. The transpiration causes a suction effect which drives water into the roots and upwards through a vascular system (the root xylem) all the way to the leaves. Both soil and roots are porous media! The appearance and structure of the root system differs between plant species and changes with environmental factors (e.g. soil water content).
Some plants exude a gel-like substance which alters the hydraulic properties of the soil and enables the plant to take up water from very dry soil. Fine root hairs on the surface of roots are assumed to play an important role for water uptake. Complex root architectures can lead to a local redistribution of the available water. Such process cannot only be observed in experiments but can also be analyzed with computer simulations. For example, the complex interaction between direct evaporation from soil and transpiration from plants can be investigated by using simulations. Here, simulations have a crucial advantage over experiments. Processes can simply be switched on and off. This allows to investigate a process and its effect in isolation as well as in interaction with other processes. On the basis of investigations with detailed models of one or a small number of plants, it can be decided whether such processes can be neglected or must be considered in large-scale simulation such as climate models.
At the University of Stuttgart, we work—together with colleagues at Forschungszentrum Jülich— on the development of novel computer models for water and nutrient transport, root-soil interaction and root growth. These models are innovative tools for the assessment of scientific theories and hypotheses about water transport in soil. However, this is only possible under the premise that these models accurately represent all considered processes. For instance, most state-of-the-art models overestimate root water uptake in dry soils for a given atmospheric pressure. We analyze computer models and create improved model which address known shortcomings.
Credits: University of Stuttgart / Timo Koch
Fractures are features which are commonly found in geological materials, and they can have a strong impact on their hydraulic and mechanical properties. For example, highly conductive fractures in a low-permeable rock can act as preferential flowpaths along which rapid fluid flow can occur. Besides that, the fractures provide interfacial areas for the transfer of mass and/or heat between the fractures and the surrounding rock. Several geotechnical engineering applications make use of this fact, as for example geothermal energy or unconventional shale gas production techniques.
The motivation for the development of the model presented here originates from a project related to underground radioactive waste storage. One approach is storing the waste inside tunnel systems that are excavated within low-permeable clay formations, which act as barriers for flow and transport of potentially radioactive components over large time scales. Transport away from the emplacement tunnels could be driven by the pressure increase that is expected to occur due to the release of hydrogen gas as a consequence of the anaerobic corrosion of the metal canisters. Besides this, the excavation of the tunnels leads to the creation of fractures in the near vicinity of the emplacement tunnels.
The scientific question that arises is how the fractures present in the surroundings of the tunnels influence the hydraulic properties of the clay rock. Clay rock is relatively soft, which is why the current hypothesis is that the dilation of the present fractures can help to reduce the pressure build-up inside the emplacement tunnels. To this end, experimental studies on cylindrical rock samples taken from the surrounding clay rock are envisaged, with which the dilation of the fractures as function of the pressure increase is to be quantified.
The model that is presented here was designed to provide a tool with the help of which the experimental results can be better interpreted, and which allows for studying the hydraulic properties of a number of synthetically generated rock samples and fracture networks. In experimental studies, this would involve very large technical and financial efforts. The model considers a poroelastic rock matrix, that is, the interaction between the flow through and the deformation of the rock sample is taken into account, and the rock is described by means of a linear elastic material law. Besides this, flow along the fractures is considered, where the fractures are modeled as two-dimensional planes as the fracture apertures are typically very small in comparison the extent of the samples. The aperture is then a variable defined on the fracture planes and is a function of the deformation of the medium. This way, the influence of the deformation on the hydraulic properties of the fractures, and in turn on the hydraulic properties of the entire sample, is captured.
Credits: University of Stuttgart / Dennis Gläser
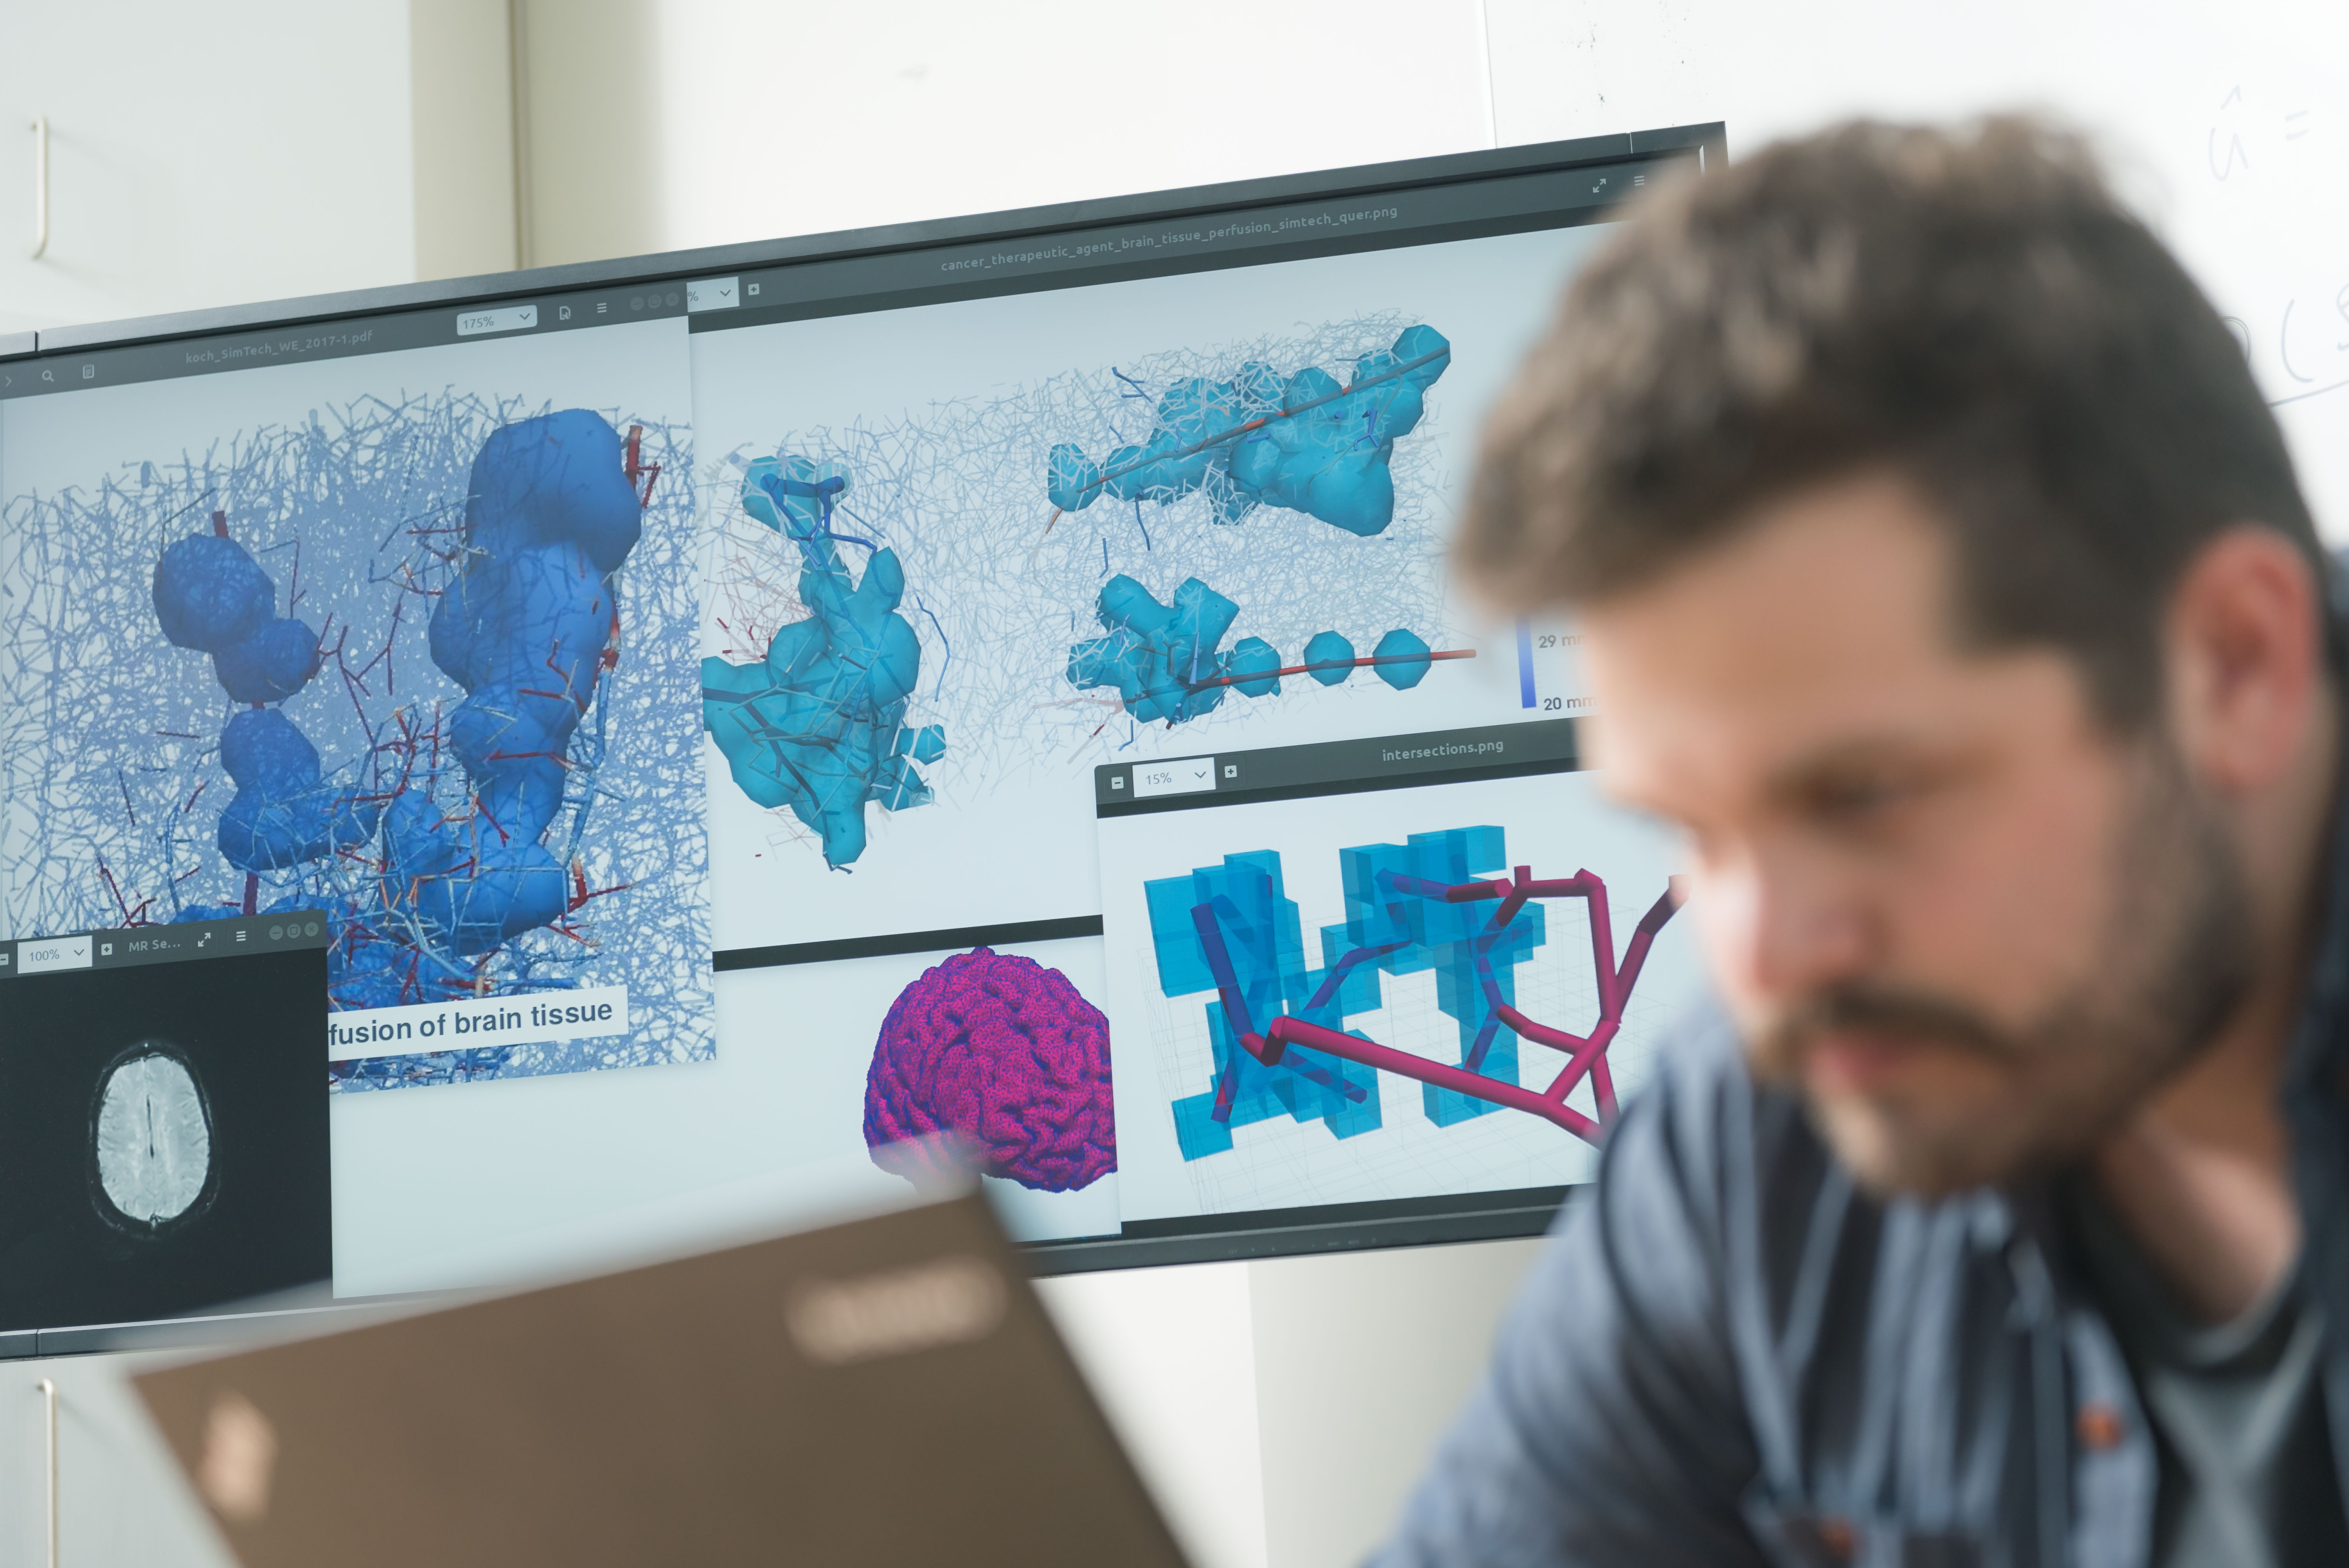
Magnetic resonance imaging (MRI) is an immensely important and versatile imaging technique used for medical imaging. The technique is based on the nuclear magnetic resonance of hydrogen atoms to radio frequency signals in strong magnetic fields. MRI avoids damaging radiation (e.g. X-rays) and is usually considered non-invasive. MRI of the brain is, for example, used in the diagnosis and therapy monitoring of brain tumors, in the analysis of neurodegenerative diseases such as Alzheimer’s or Parkinson’s disease, and diseases of the central nervous system, such as multiple sclerosis. In a variant of MRI called perfusion MRI, a contrast agent is injected into the blood stream and a sequence of MR images is taken to observe the fate of this contrast agent.
Why is it important that the brain is a porous medium?
Like most biological soft tissues, brain tissue consists of a mixture of cells, fibres, and fluid within the cells and the interstitial space (pore space). Cells are supplied by blood vessels with oxygen and nutrients. The blood vessels also consist of cells and blood is a mixture of fluid and various cells. This complex tissue architecture complicates the interpretation of the MRI images.
How can computer simulations help?
Computer models are the basis for the image post-processing done for perfusion MRI data. The model simulates both contrast agent perfusion and the resulting MRI signal and compares the result with the data. Hereby, certain properties of the brain tissue can be inferred. For example, the blood volume fraction can be estimated—an important biomarker for tumors, but equally important to assess the possible damage after a stroke. Simple simulations only take seconds and thus immediately provide important additional informations to medical doctors for decision making.
At the University of Stuttgart, researchers develop novel simulation techniques with the goal of extracting further information from MRI data. Using computer simulations, they try to better understand how contrast agent spreads in brain tissue and how different properties of the tissue influence MRT data.
Credits: University of Stuttgart / Timo Koch
What is visualization? making hidden things visible
Computer simulations result in enormous amounts of data. Finding answers is like searching for the proverbial “needle in a haystack”. Pictures or graphics are essential here. They make visible what would be otherwise remain hidden from the eye.
„Today we have a constantly increasing flood of data. Even their calculation and storage is very complex. Therefore, the data must be prepared accordingly. This is where visualization comes in.” – Prof. Thomas Ertl, Head of the Visualization Institute and Spokesperson of the Cluster of Excellence EXC 2075 “Data-Integrated Simulation Science” at the University of Stuttgart.

University of Stuttgart / VISUS
University of Stuttgart / VISUS / SFB 716
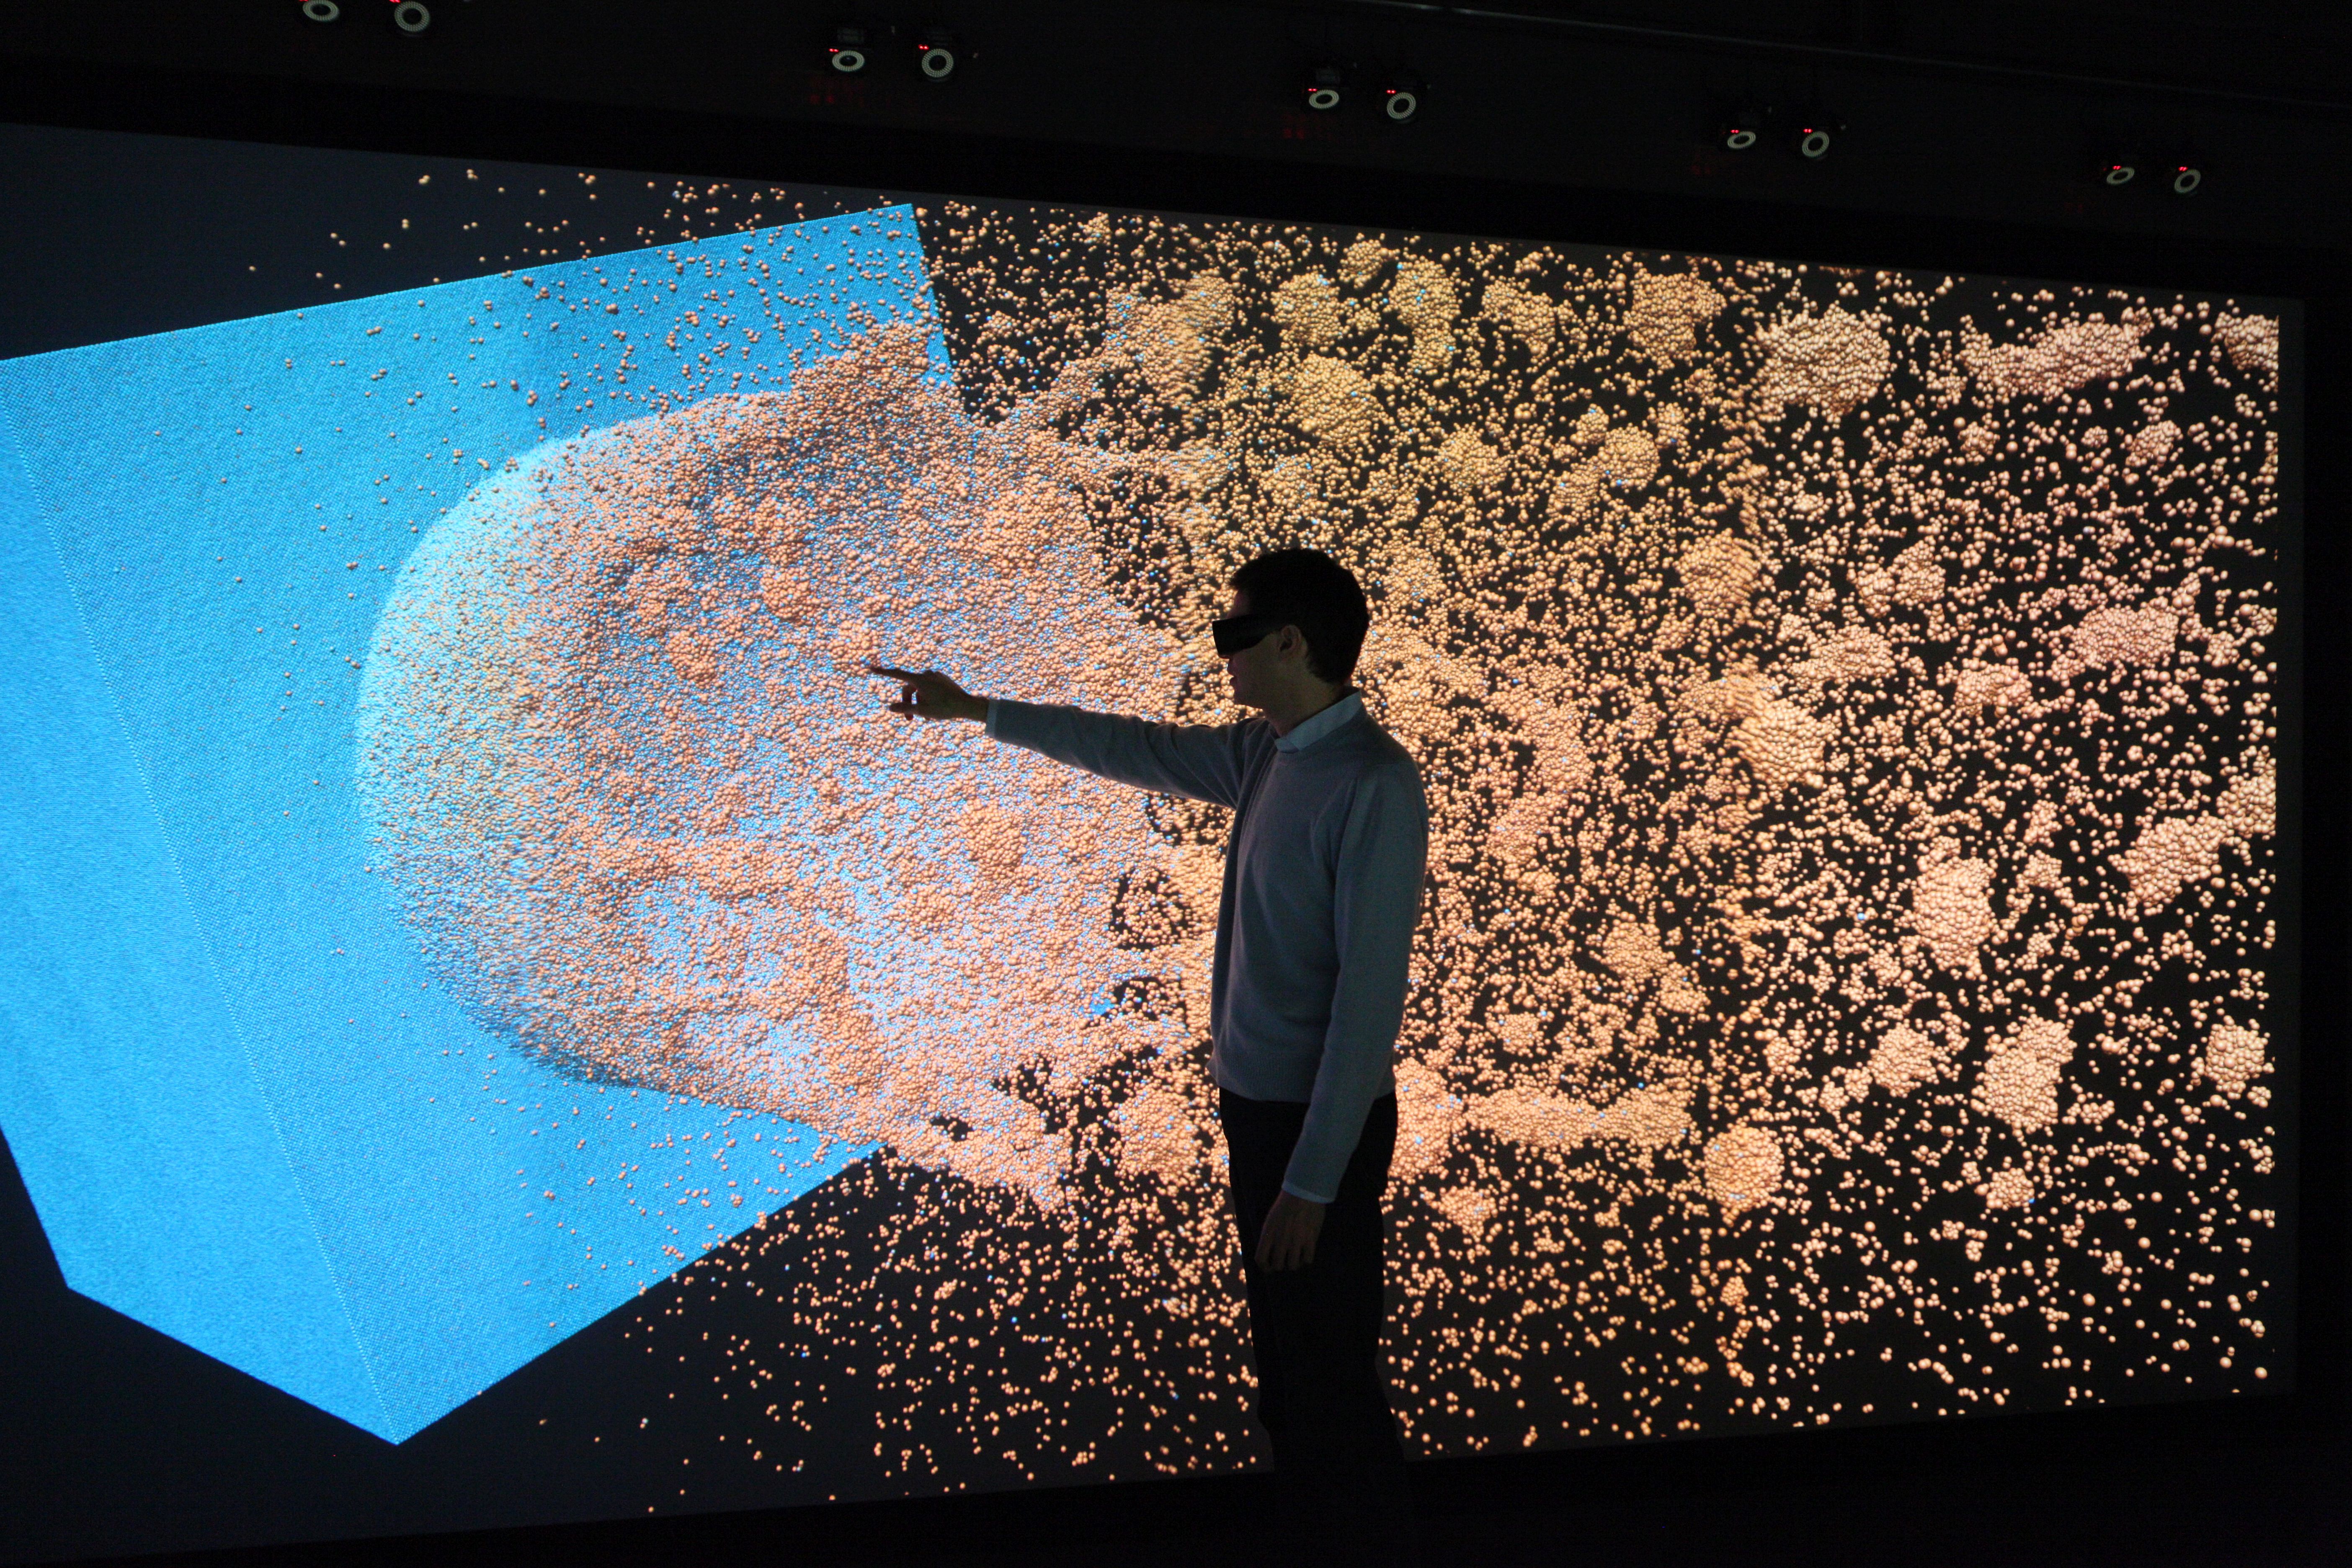
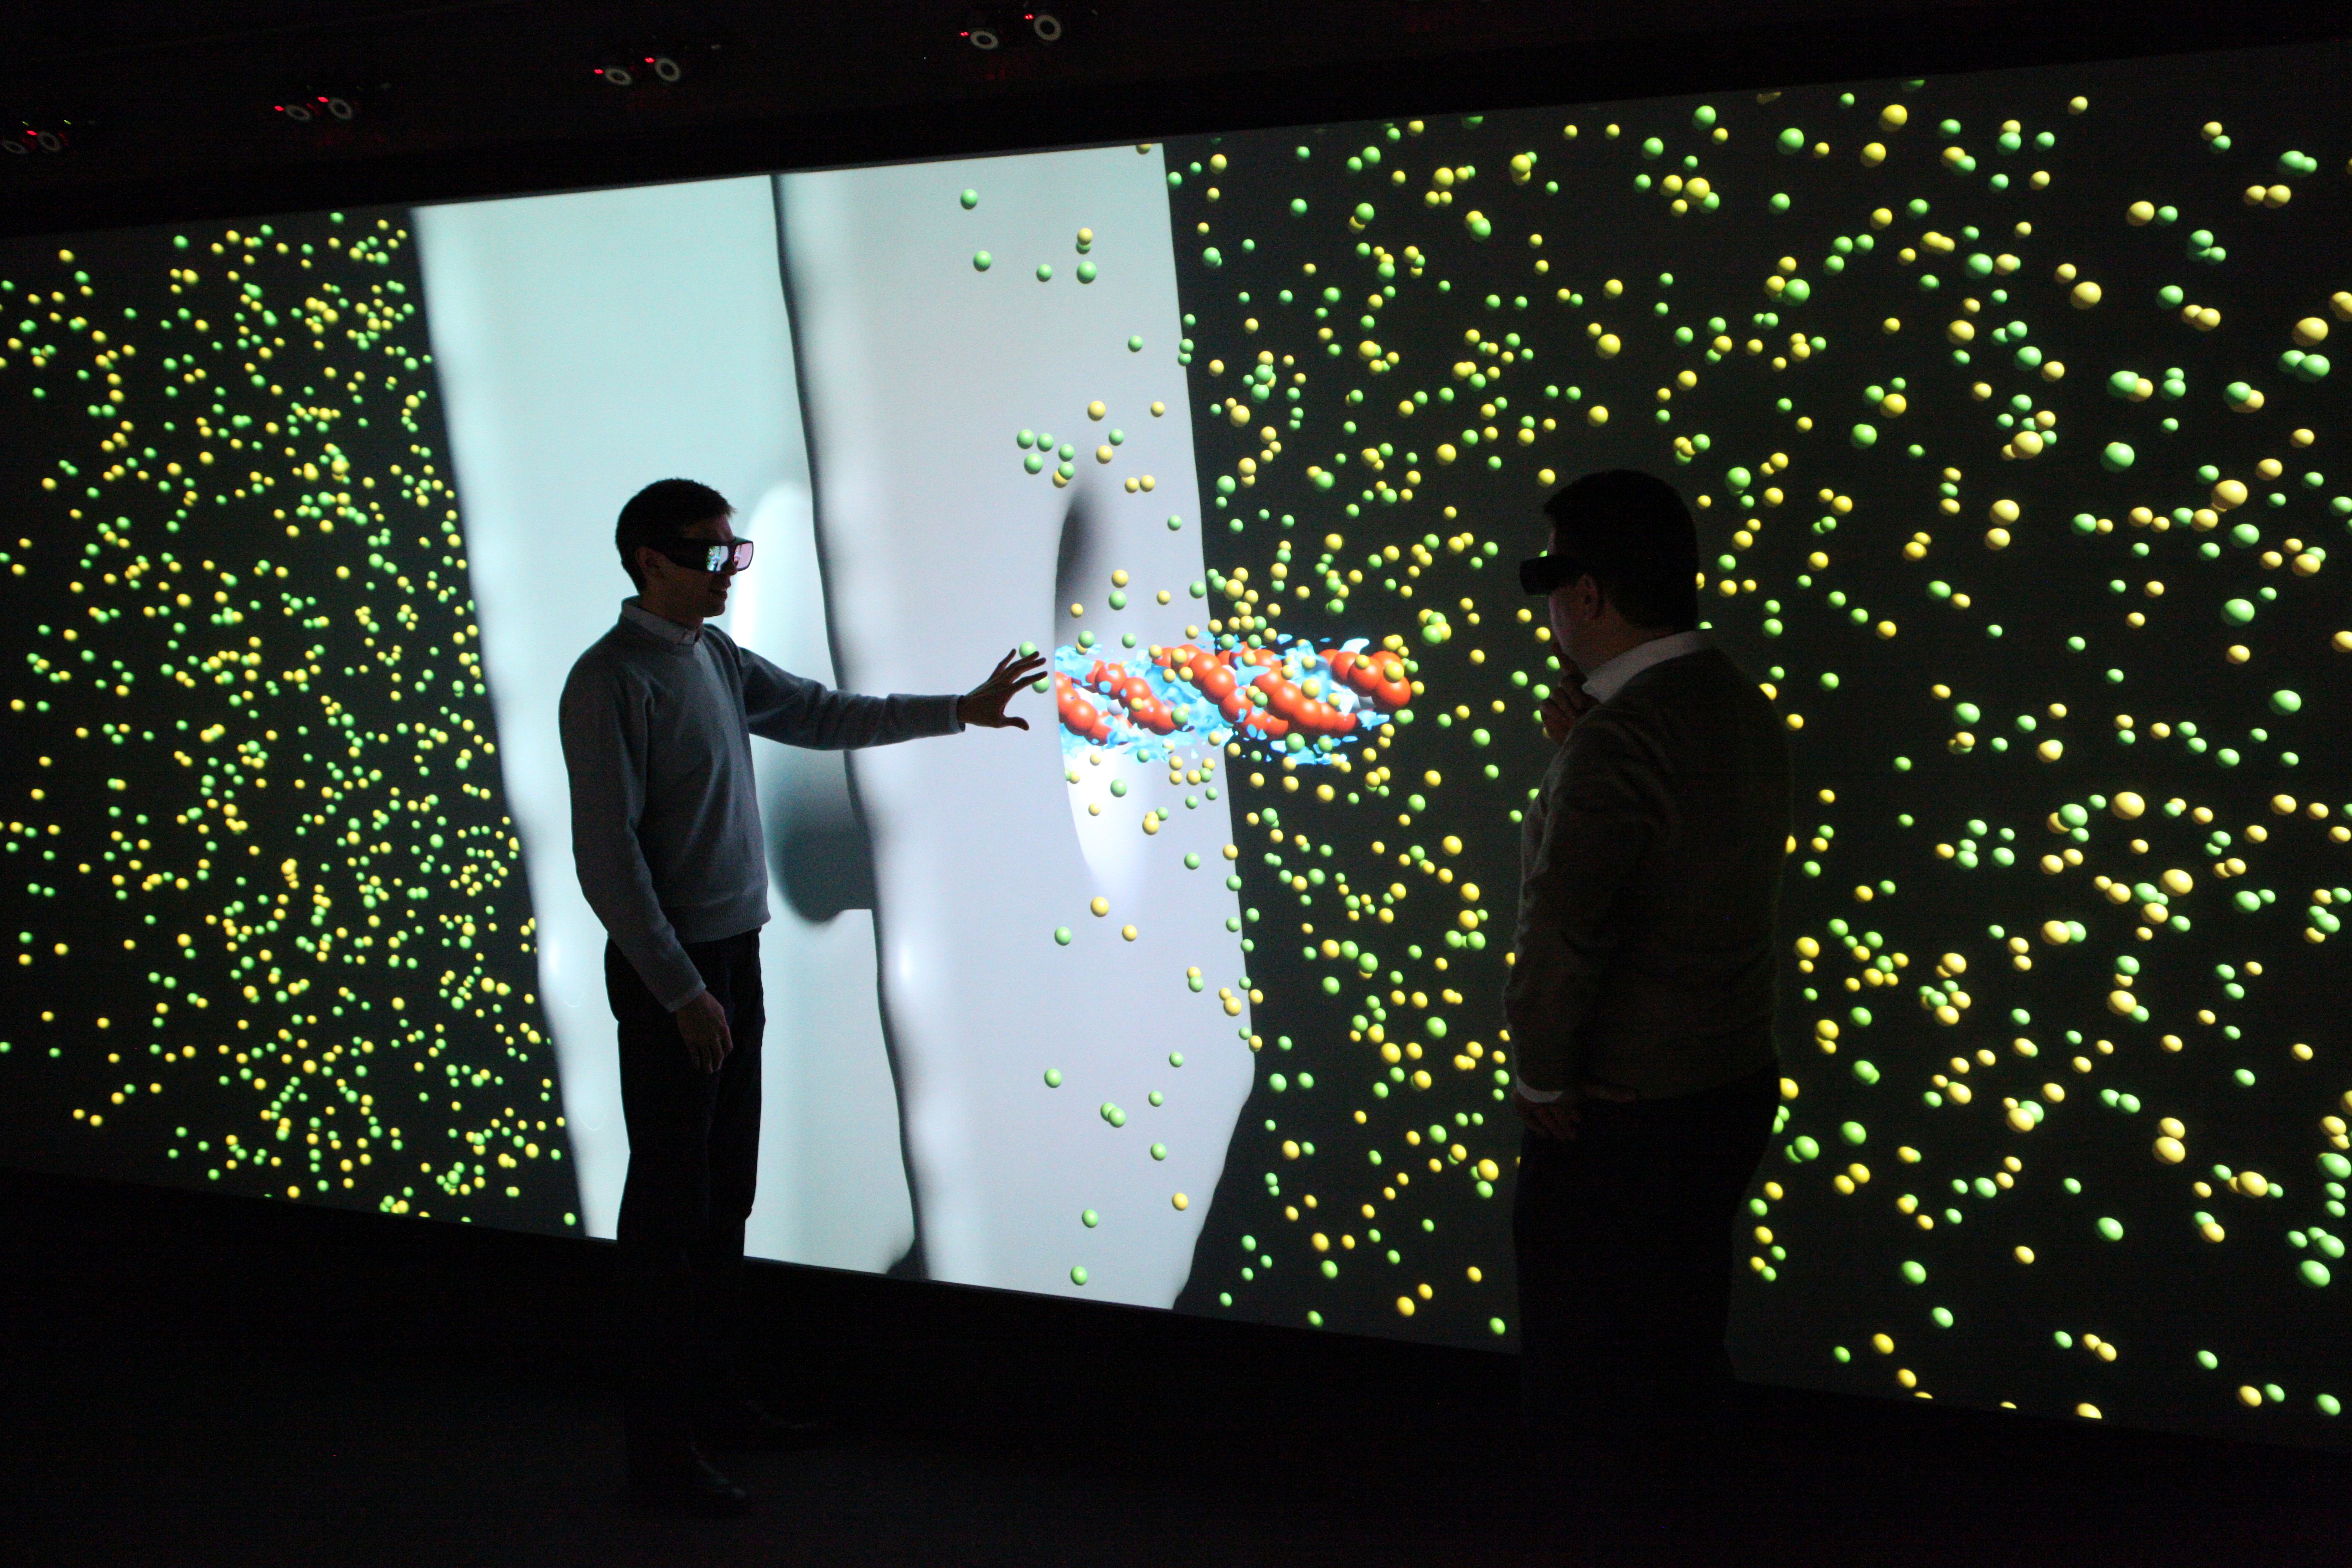
Visualizations transform the data from computer simulations into graphic representations. Scientists can often use these images to interpret the information in the data more easily. Scientific visualizations are usually three-dimensional and interactive, which means that they can be viewed from all sides.
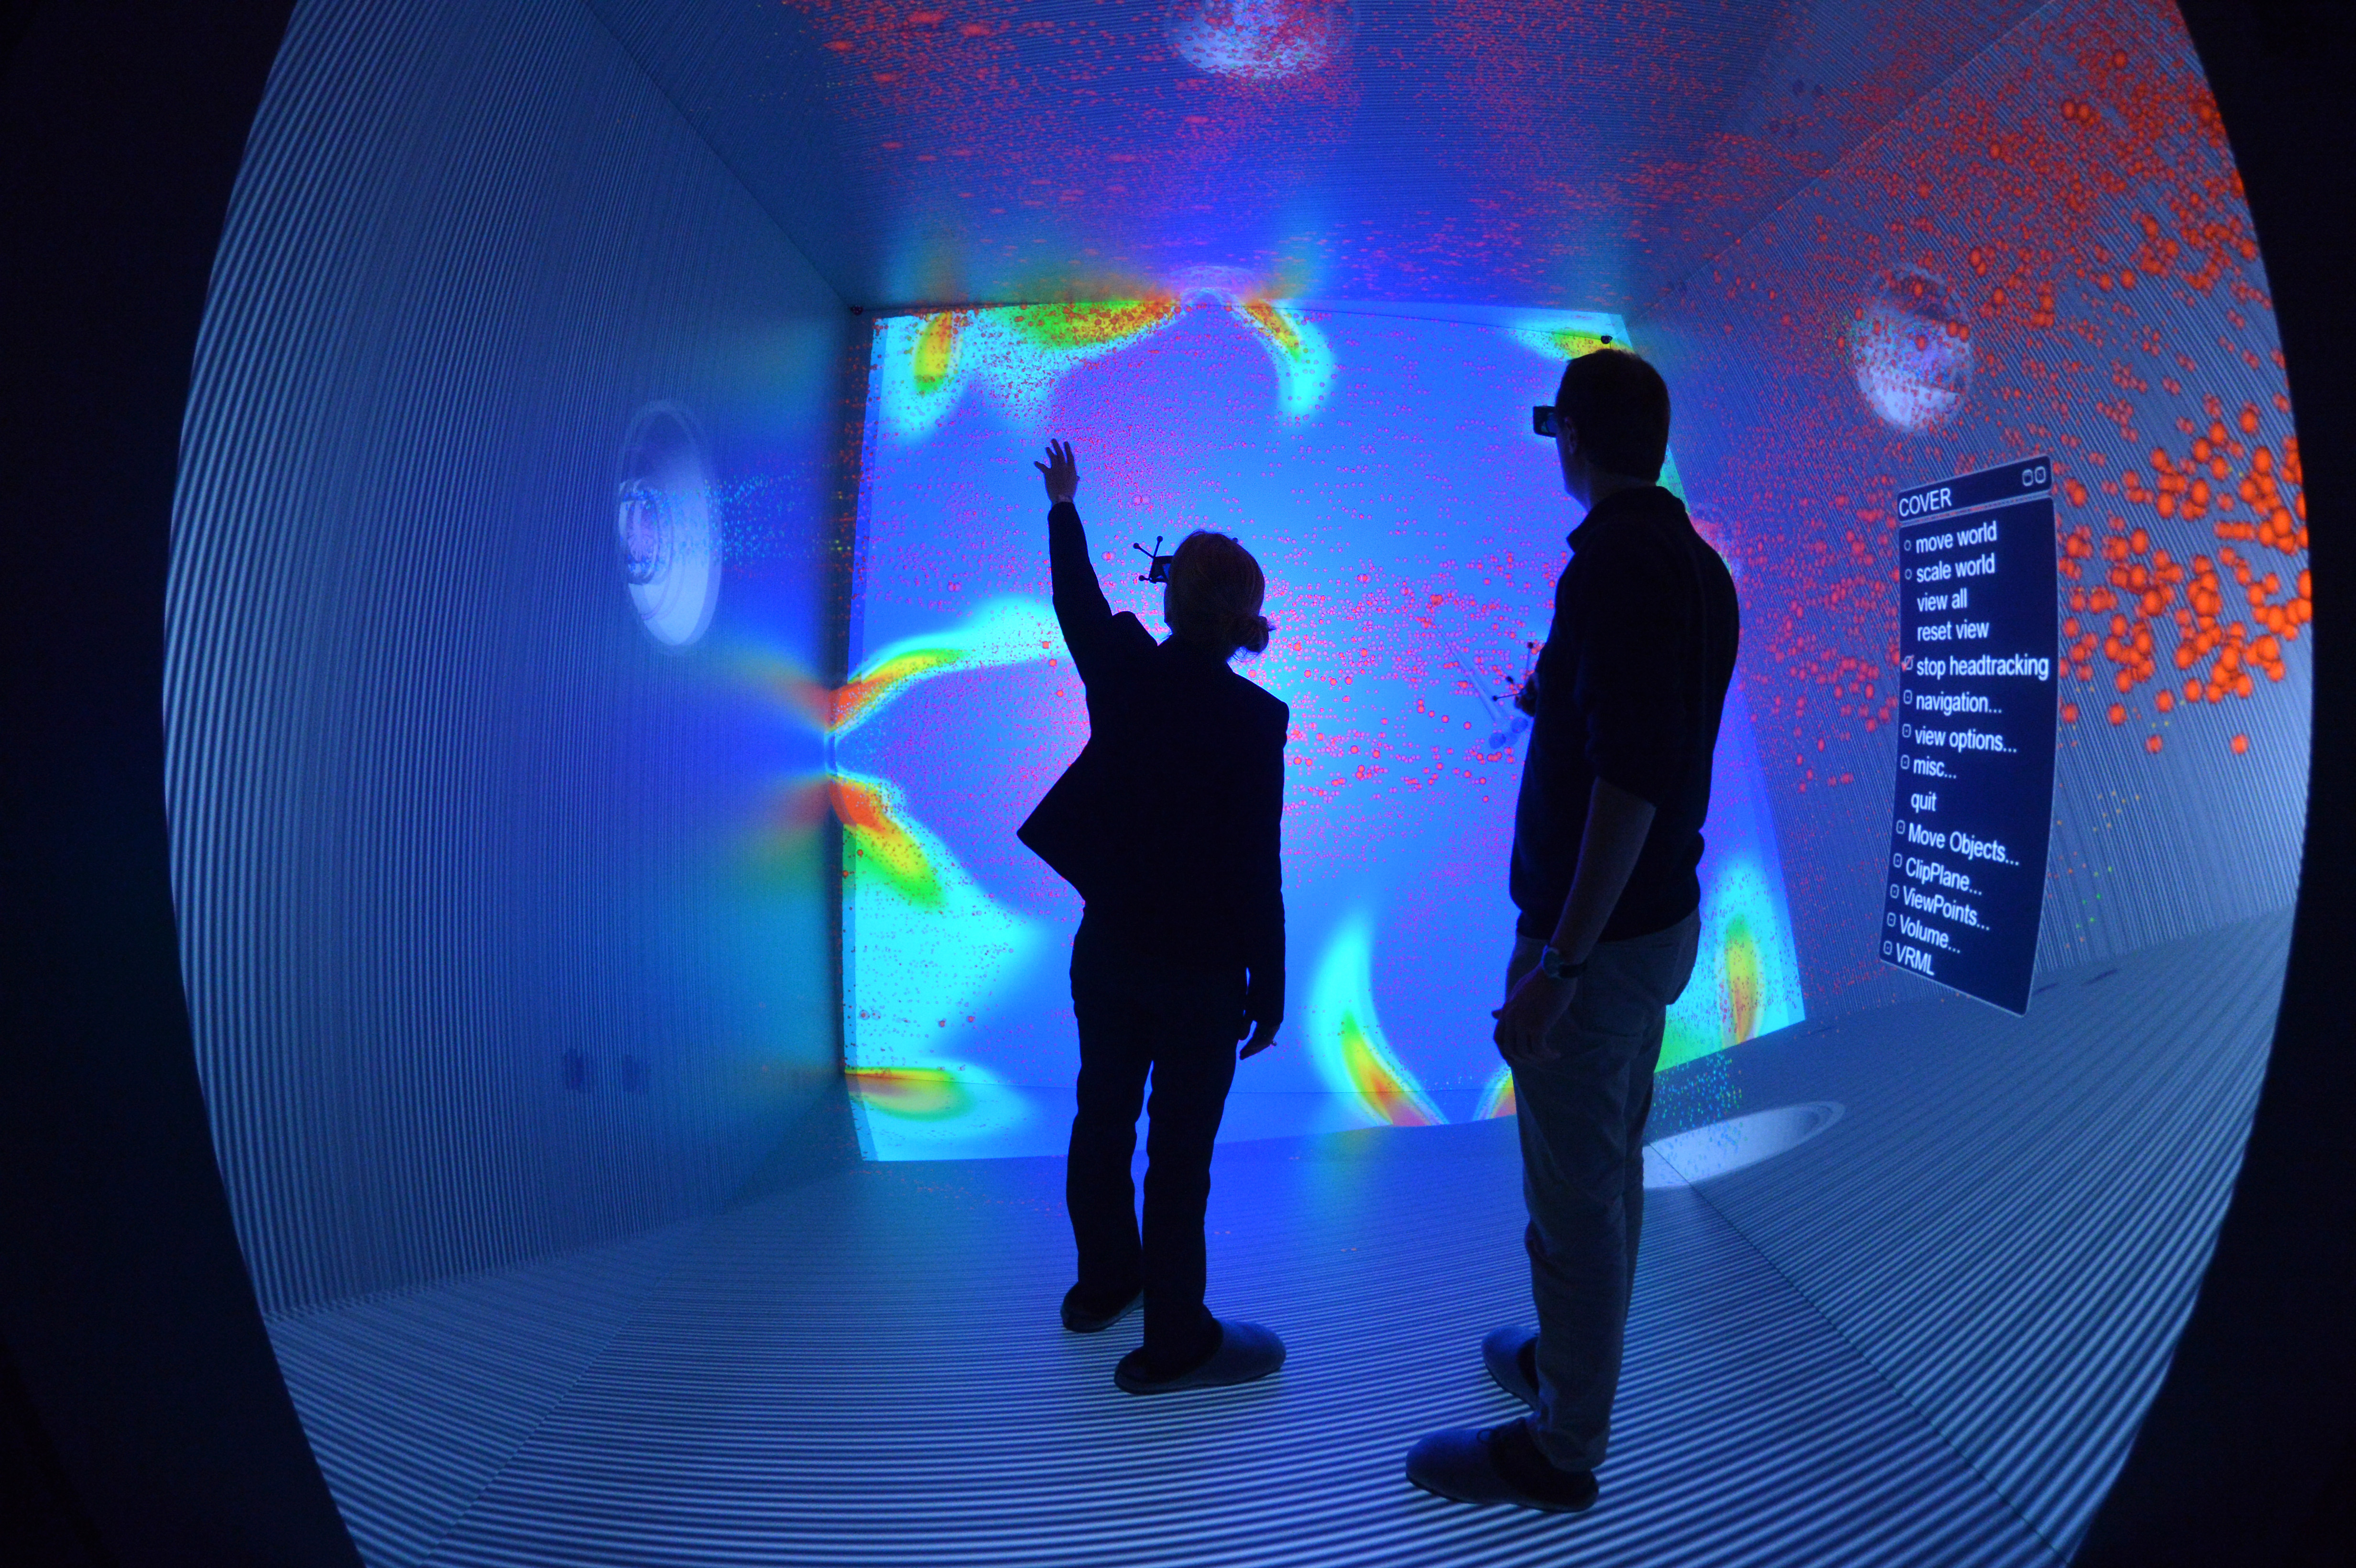
Visualizations on high-resolution large projection screens make even the smallest details visible, which would hardly be visible on normal screens. The size of the screen also makes it easier for the scientists to analyze the data together.
University of Stuttgart / VISUS
University of Stuttgart / VISUS

University of Stuttgart / VISUS
University of Stuttgart / David Ausserhofer
University of Stuttgart / VISUS / SFB 716
Making the hidden visible: How data becomes images
University of Stuttgart / VISUS
The results of computer simulations are data sets. More and more details, larger systems and longer periods of time are what experts from numerous disciplines want to look at in order to gain new insights. Finding answers in this flood of data increasingly resembles searching for the proverbial “needle in a haystack”. Pictures or graphics of the abstract information are essential for this. They make visible what would otherwise remain hidden from the human eye.
The weather map in the evening, car navigation or the election results of the current federal election – in our everyday lives, images often show us what has been compiled in elaborate measurements, extensive data collections or complicated calculations. Scientists and developers are no different. Complex information or processes are most easily examined in graphical representations. But what has to happen so that the weather map flickers across the screen or an engineer can examine his idea on the computer?
Thanks to visualization, data sets generated in computer simulations are converted into visual images. This makes the seemingly unmanageable information interpretable and analyzable.
Visualizations are mostly interactive and three-dimensional. They can be viewed from all sides, individual parameters can be shown or hidden and special features can be highlighted. The display on high-resolution large projection screens also provides a comprehensive impression of all details. With interactive real-time graphics, conceptual considerations and possible implementation variants can be experienced at an early stage.
University of Stuttgart / VISUS
University of Stuttgart / VISUS
Step by step – the visualization process
01 Raw data
At the beginning of the visualization process there is an abstract, unmanageable amount of numbers – the data. Not all information can always be represented graphically. This is why scientists determine what is important to answer a question. This means that the data is filtered so that only those parts relevant to the analysis are visualized.
02 Mapping
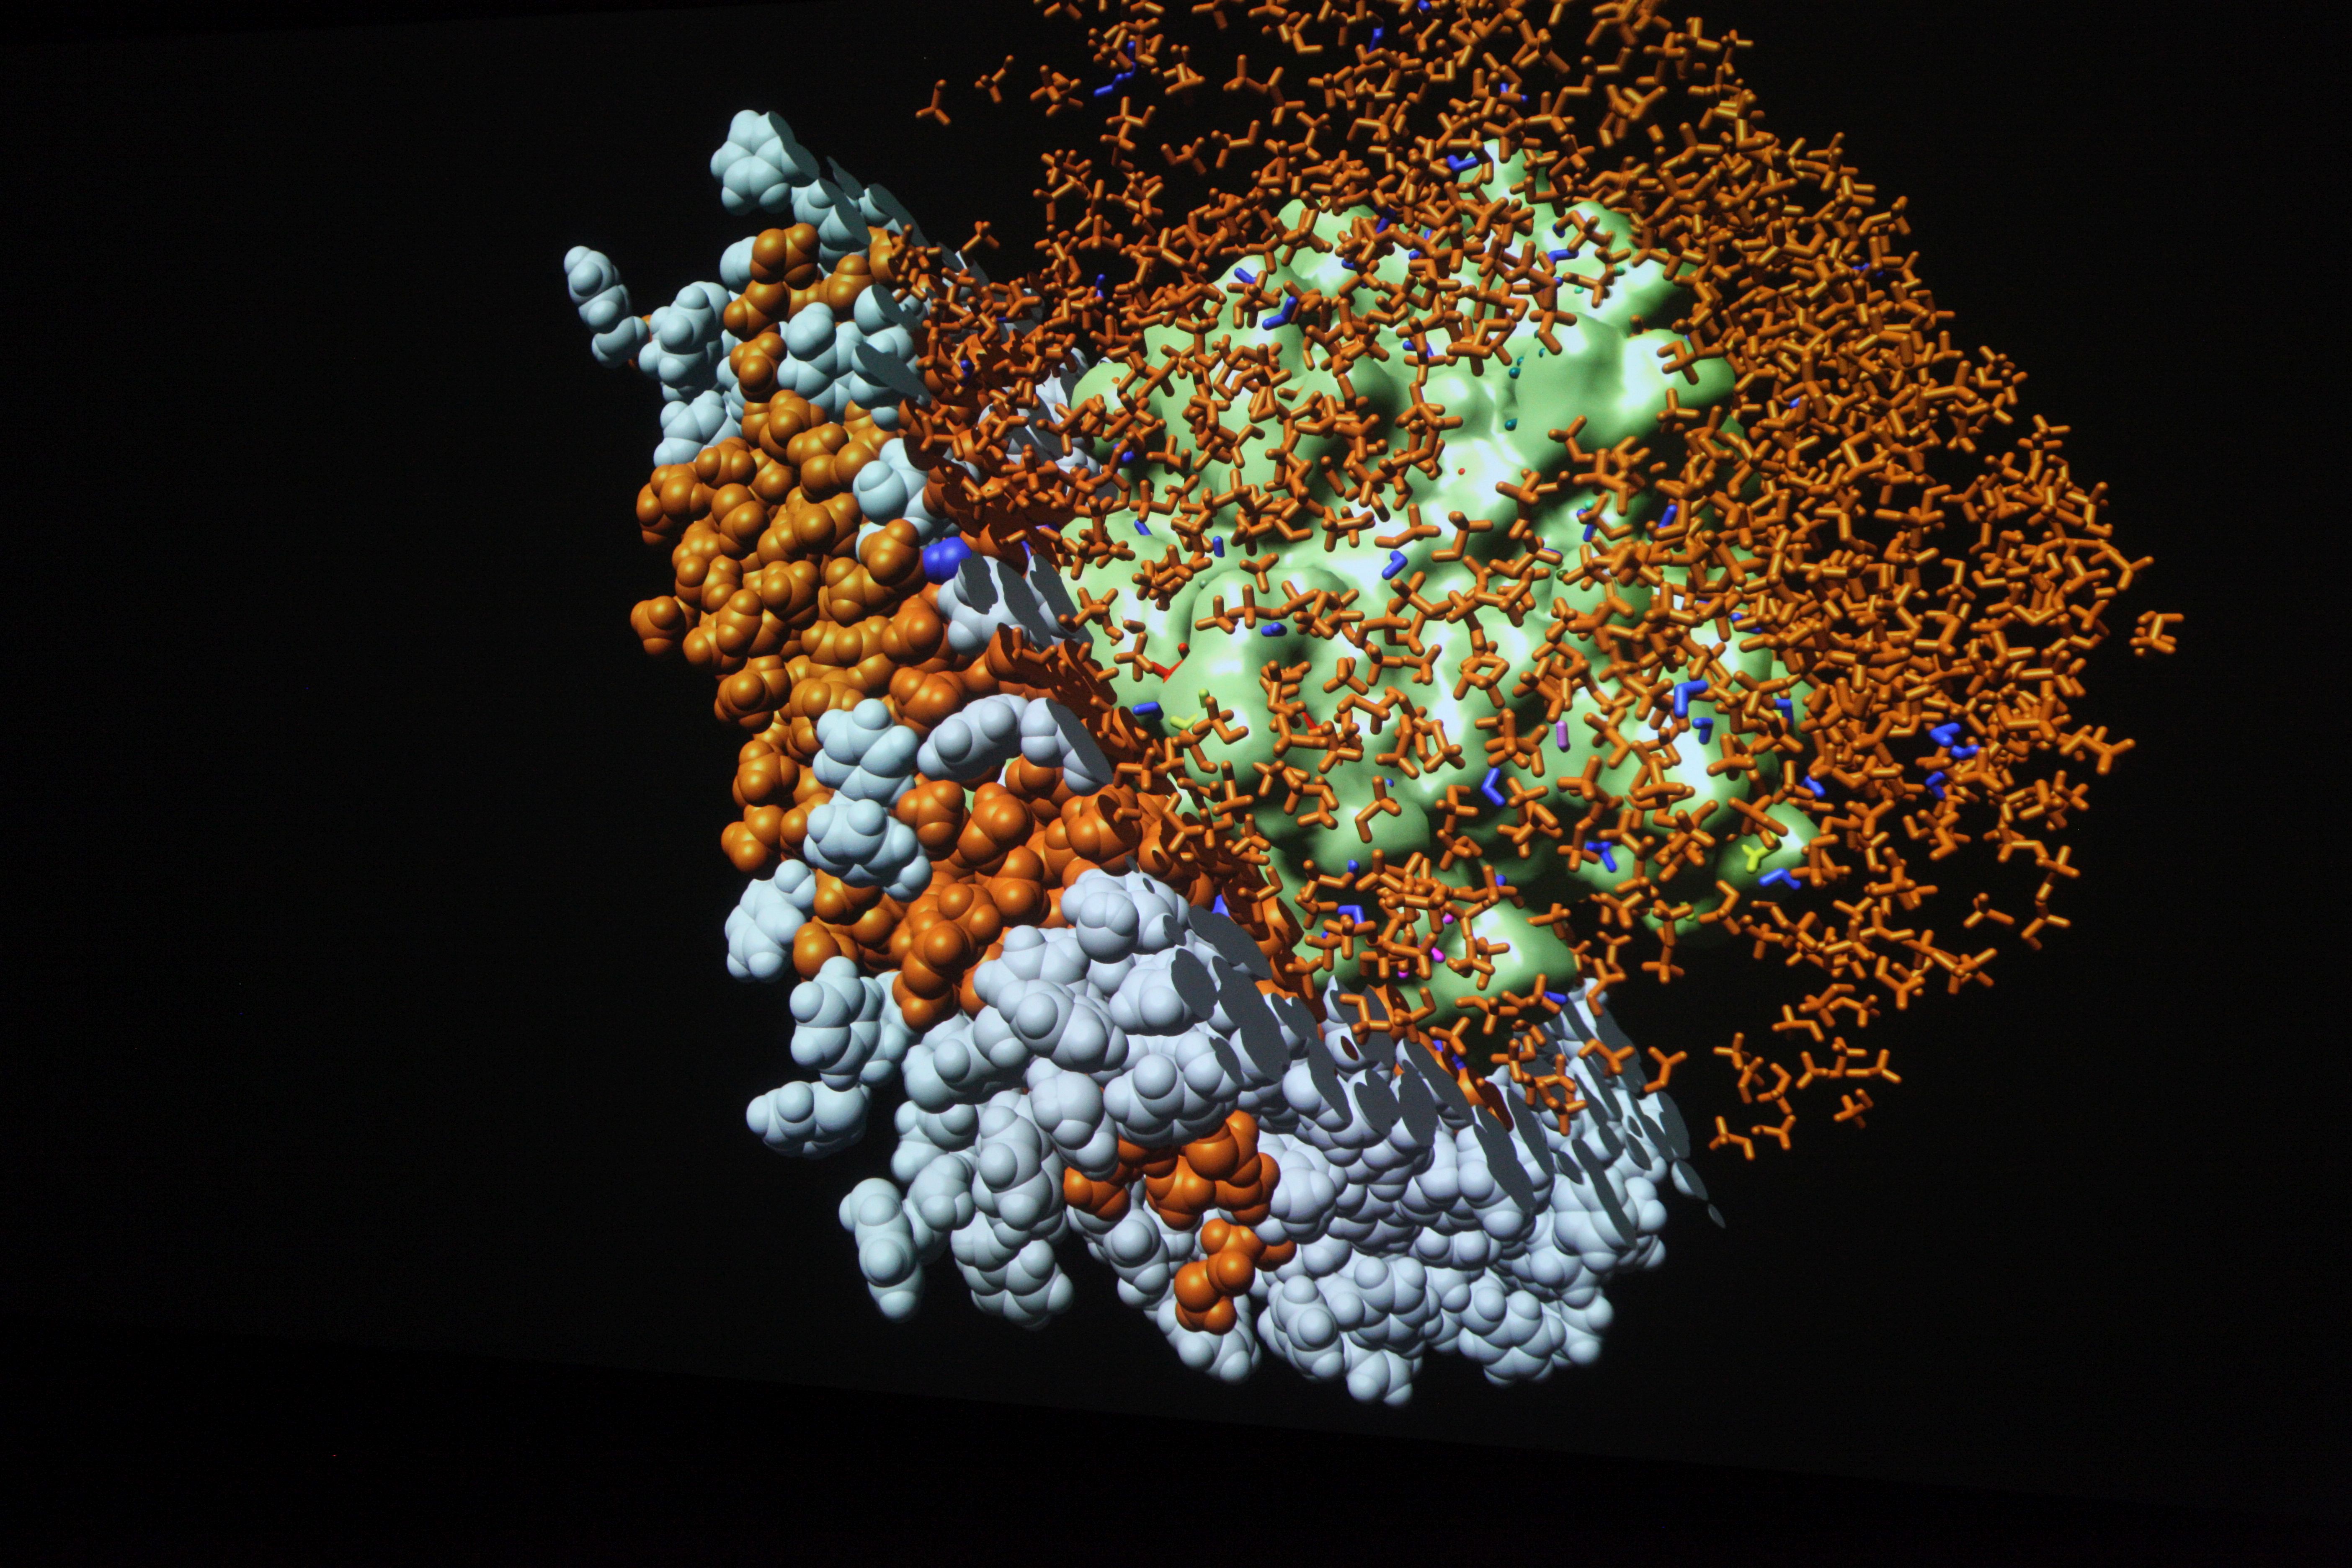
For the filtered data it is now defined how they are graphically displayed. For example, atoms are usually visualized as spheres.
03 Rendering
The graphical representation of the previously selected representations is calculated. In addition, the angle from which the data is to be displayed is determined.
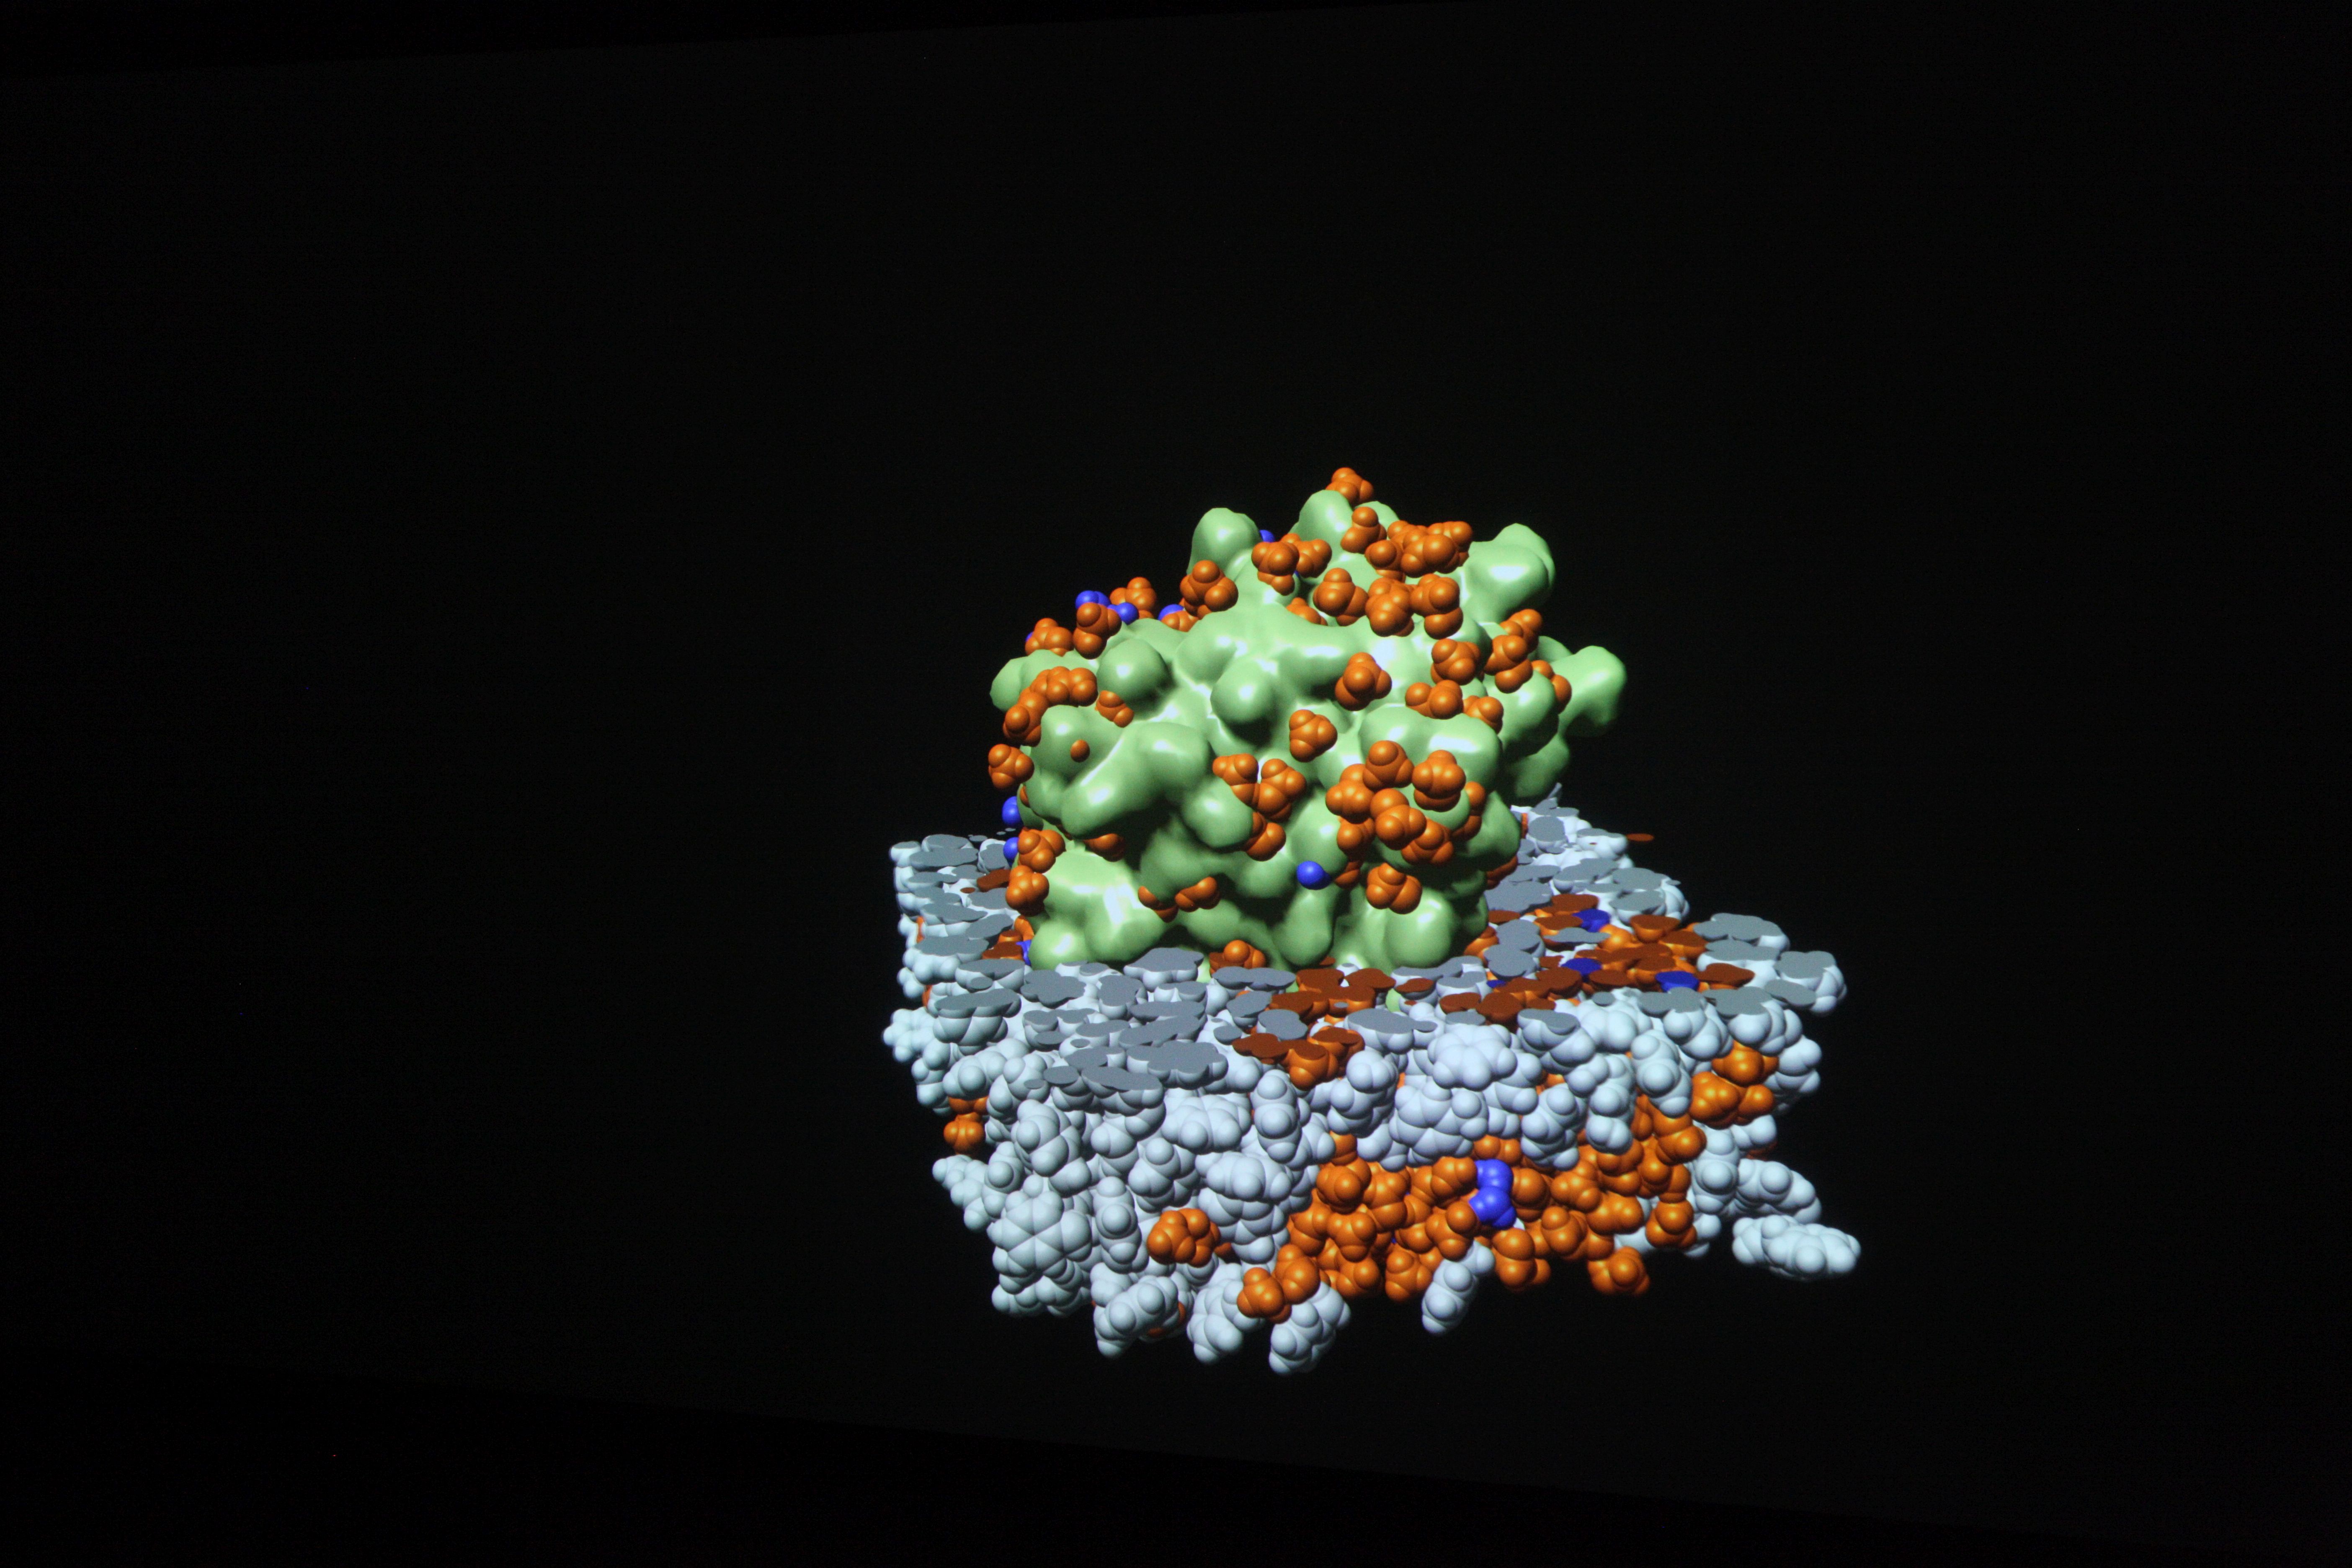
04 Finale Visualisierung
The result is a three-dimensional, interactive image that can be used to analyze the information selected in the first step.
Avoiding complications during osteoporosis treatment
Percutaneous vertebroplasty involves injecting a so-called bone cement into the vertebrae of patients suffering from osteoporosis. The treatment is minimally invasive: the surgeon gradually injects a few milliliters of the bone cement whilst continuously MRI images of the patient’s brain, to determine the best fit and, at the same time, most physically useful, meaningful parameters”, Koch explains. This process is done automatically, whereby the most relevant parameters are those that describe the physical properties of the materials. For instance, diffusion coefficients for the capillary walls can be found in the scientific literature or from the geometry of the capillaries. “A total of about ten parameters used in our model have an influence on the calculations”, says Koch.
“The concentration profile with which the contrast medium moves through the capillaries is ultimately unknown, which means that you have to play through a reasonable range of values”. Finally, the researcher has to merge the flow model with the MRI images. Only then can useful conclusions be drawn about the development of the lesions. To this end, Koch also models the MRI imaging in a subordinated simulation. In this way, the researchers hope to gain a better understanding of the flow processes of an MS sufferer’s brain than can be achieved with existing models. Special research for porous media The technical know-how about porous media available in Stuttgart is not just a reflection of Koch’s research. In autumn 2017, the University received approval for a German Research Foundation (DFG) collaborative research center (CRC) focused on “boundary surface-driven multi-field processes in porous media”. Over 20 scientists from several of the University’s institutes participate in checking the results with x-ray images. “It’s a standard treatment”, says Röhrle, “but, unfortunately, complications, such as bone cement leaking out of the vertebra, do occur from time-to-time. Moreover, the surgeon never knows how the bone cement will alter the mechanical behavior of the human musculoskeletal system”. Ultimately, the patient’s vertebrae, ligaments, tendons and muscles will have adapted to the altered structure of the backbone. “Then there’s the fact that, in the final analysis, the injected bone cement spreads differently in every patient”.
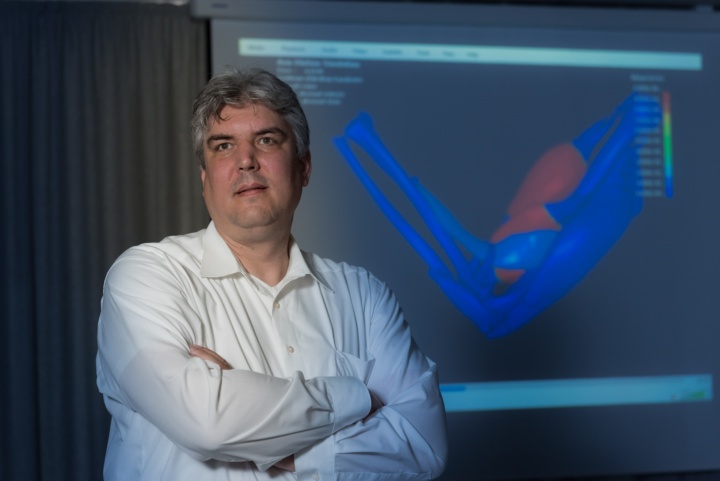
Photo: University Stuttgart / Max Kovalenko
„It’s a standard treatment, but, unfortunately, complications, such as bone cement leaking out of the vertebra, do occur from time-to-time. Moreover, the surgeon never knows how the bone cement will alter the mechanical behavior of the human musculoskeletal system.“
Oliver Röhrle, Professor for Continuum Biomechanics and Mechanobiology at the University of Stuttgart.
From a fluid mechanics perspective, percutaneous vertebroplasty is a typical example for the processes in porous media. The injected bone cement sets within the vertebra, so that when it first enters the bone it causes a volume change and then, after setting results in a phase change from fluid to solid. “We’re trying to use simulations to describe these processes”, says Röhrle. And, at the same time, to take account of the properties of at least three materials – bone, bone marrow and bone cement. To validate the Stuttgart model, the scientists will be collaborating with the AO Research Institute Davos. “They have experimental laboratory set-ups there as well as the clinical problems that we require for our model development”, Röhrle explains. Only once the results of this first phase are available will the project participants be able to approach the question in which they are really interested: what exactly happens when a vertebra breaks or cracks?
— Michael Vogel (Forschung Leben, Ausgabe 11/2018)
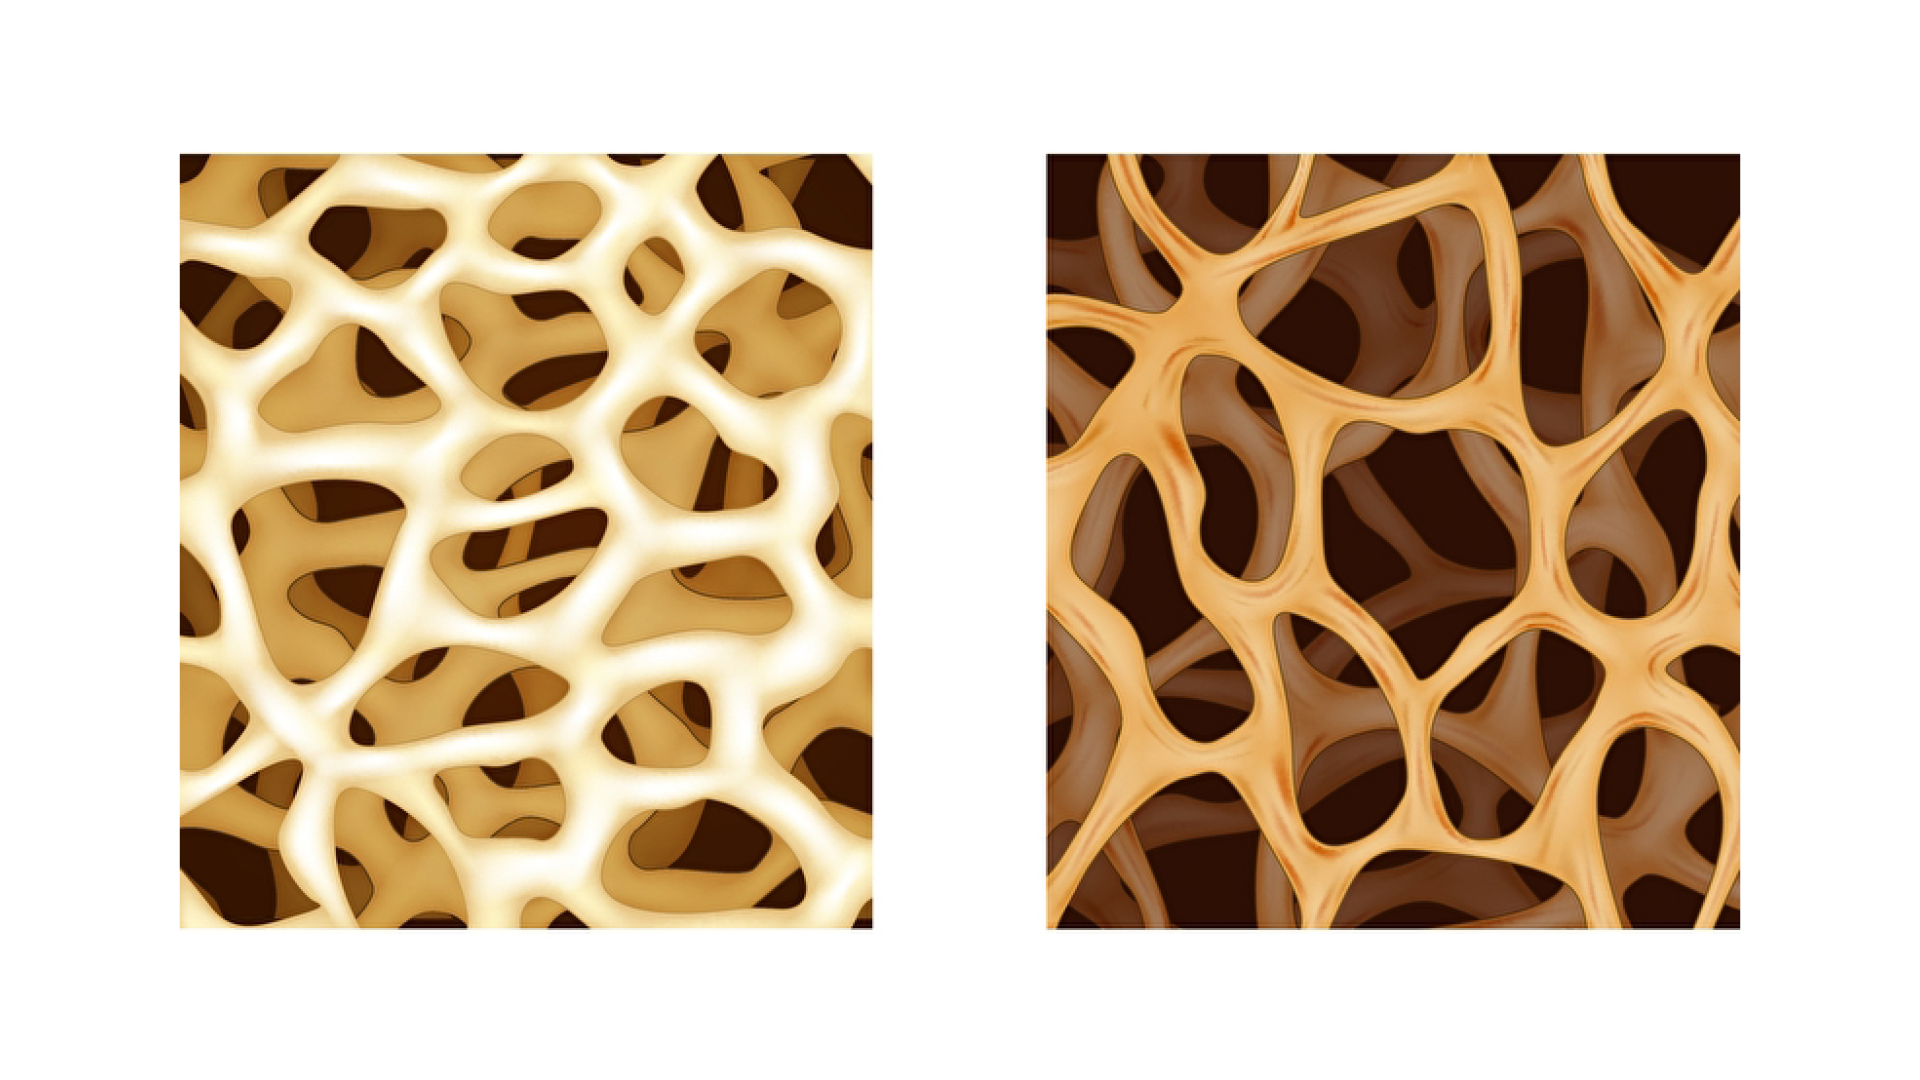
As we age, our bones lose their bone mass. That means that the density drops, their cavities become larger and the stability of the bones decreases. This disease is called osteoporosis. Osteoporosis therefore often results in bone fractures.
Credits: PantherMedia / Teguh Mujiono
Credits: PantherMedia / Artemida-psy und rob3000
Stabilization of fractured vertabrae
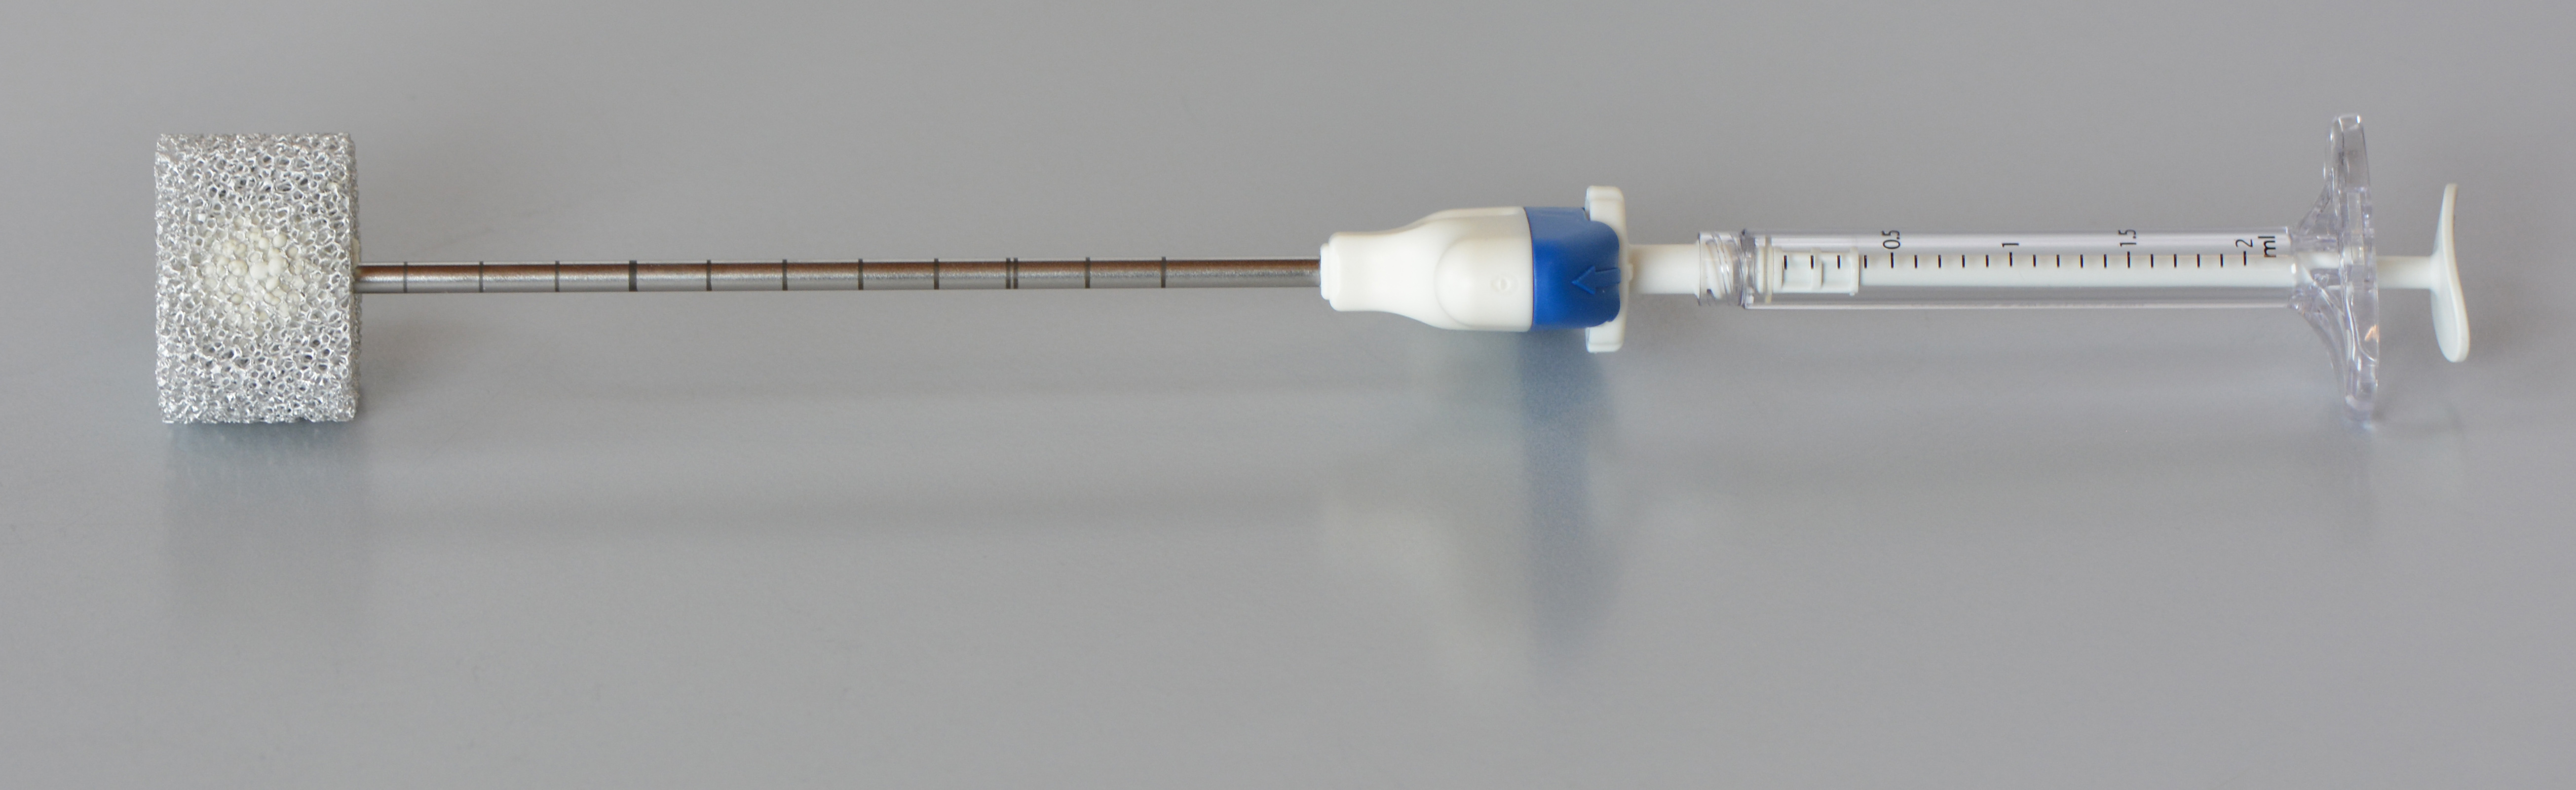
One of the procedures for stabilisation of (fractured) vertabrae is the so-called “percutaneous vertebroplasty”. This treatment method allows physicians to “refill” and stabilize the bone by injecting the so-called “bone cement” into the vertebrae of patients suffering from osteoporosis. Step by step, few milliliters of bone cement are injected while repeatedly checking the spread of the bone cement by means of X-rays. The “liquid” bone cement hardens within approximately 20 minutes and stabilizes the bone.
Credits: AO Foundation Davos / Dominic Gehweiler
Credits: AO Foundation Davos / Dominic Gehweiler
Credits: AO Foundation Davos / Dominic Gehweiler
Credits: AO Foundation Davos / Dominic Gehweiler
International cooperation
The University of Stuttgart* in collaboration with the AO Research Institute Davos* (Switzerland) perform joint research in this field. Scientists at the University of Stuttgart use the experimental data from Davos to generate simulations. This knowledge can help physicians to better understand vertebroplasty and improve this treatment method. Furthermore, these simulations are also important to detect and avoid possible complications (e.g. bone cement leakage, damage to the nerves in the spine, etc.).
*Oliver Röhrle (University of Stuttgart) / Boyko Gueorguiev-Rüegg (AO Foundaitio, Davos)
Credits: AO Foundation Davos / Dominic Gehweiler
Credits: University of Stuttgart / Christian Bleiler
In-depth text of the simulation of a bone cement infection and the spread of the mass.
If we take a look at this fictitious city, we can see the different earth and rock layers underneath. There is groundwater in every layer. The deeper the layer, the higher the temperature. In Germany, regardless of the season, it gets warmer by about 3 °C on average per 100 m of depth. That means that also the groundwater temperature increases accordingly.
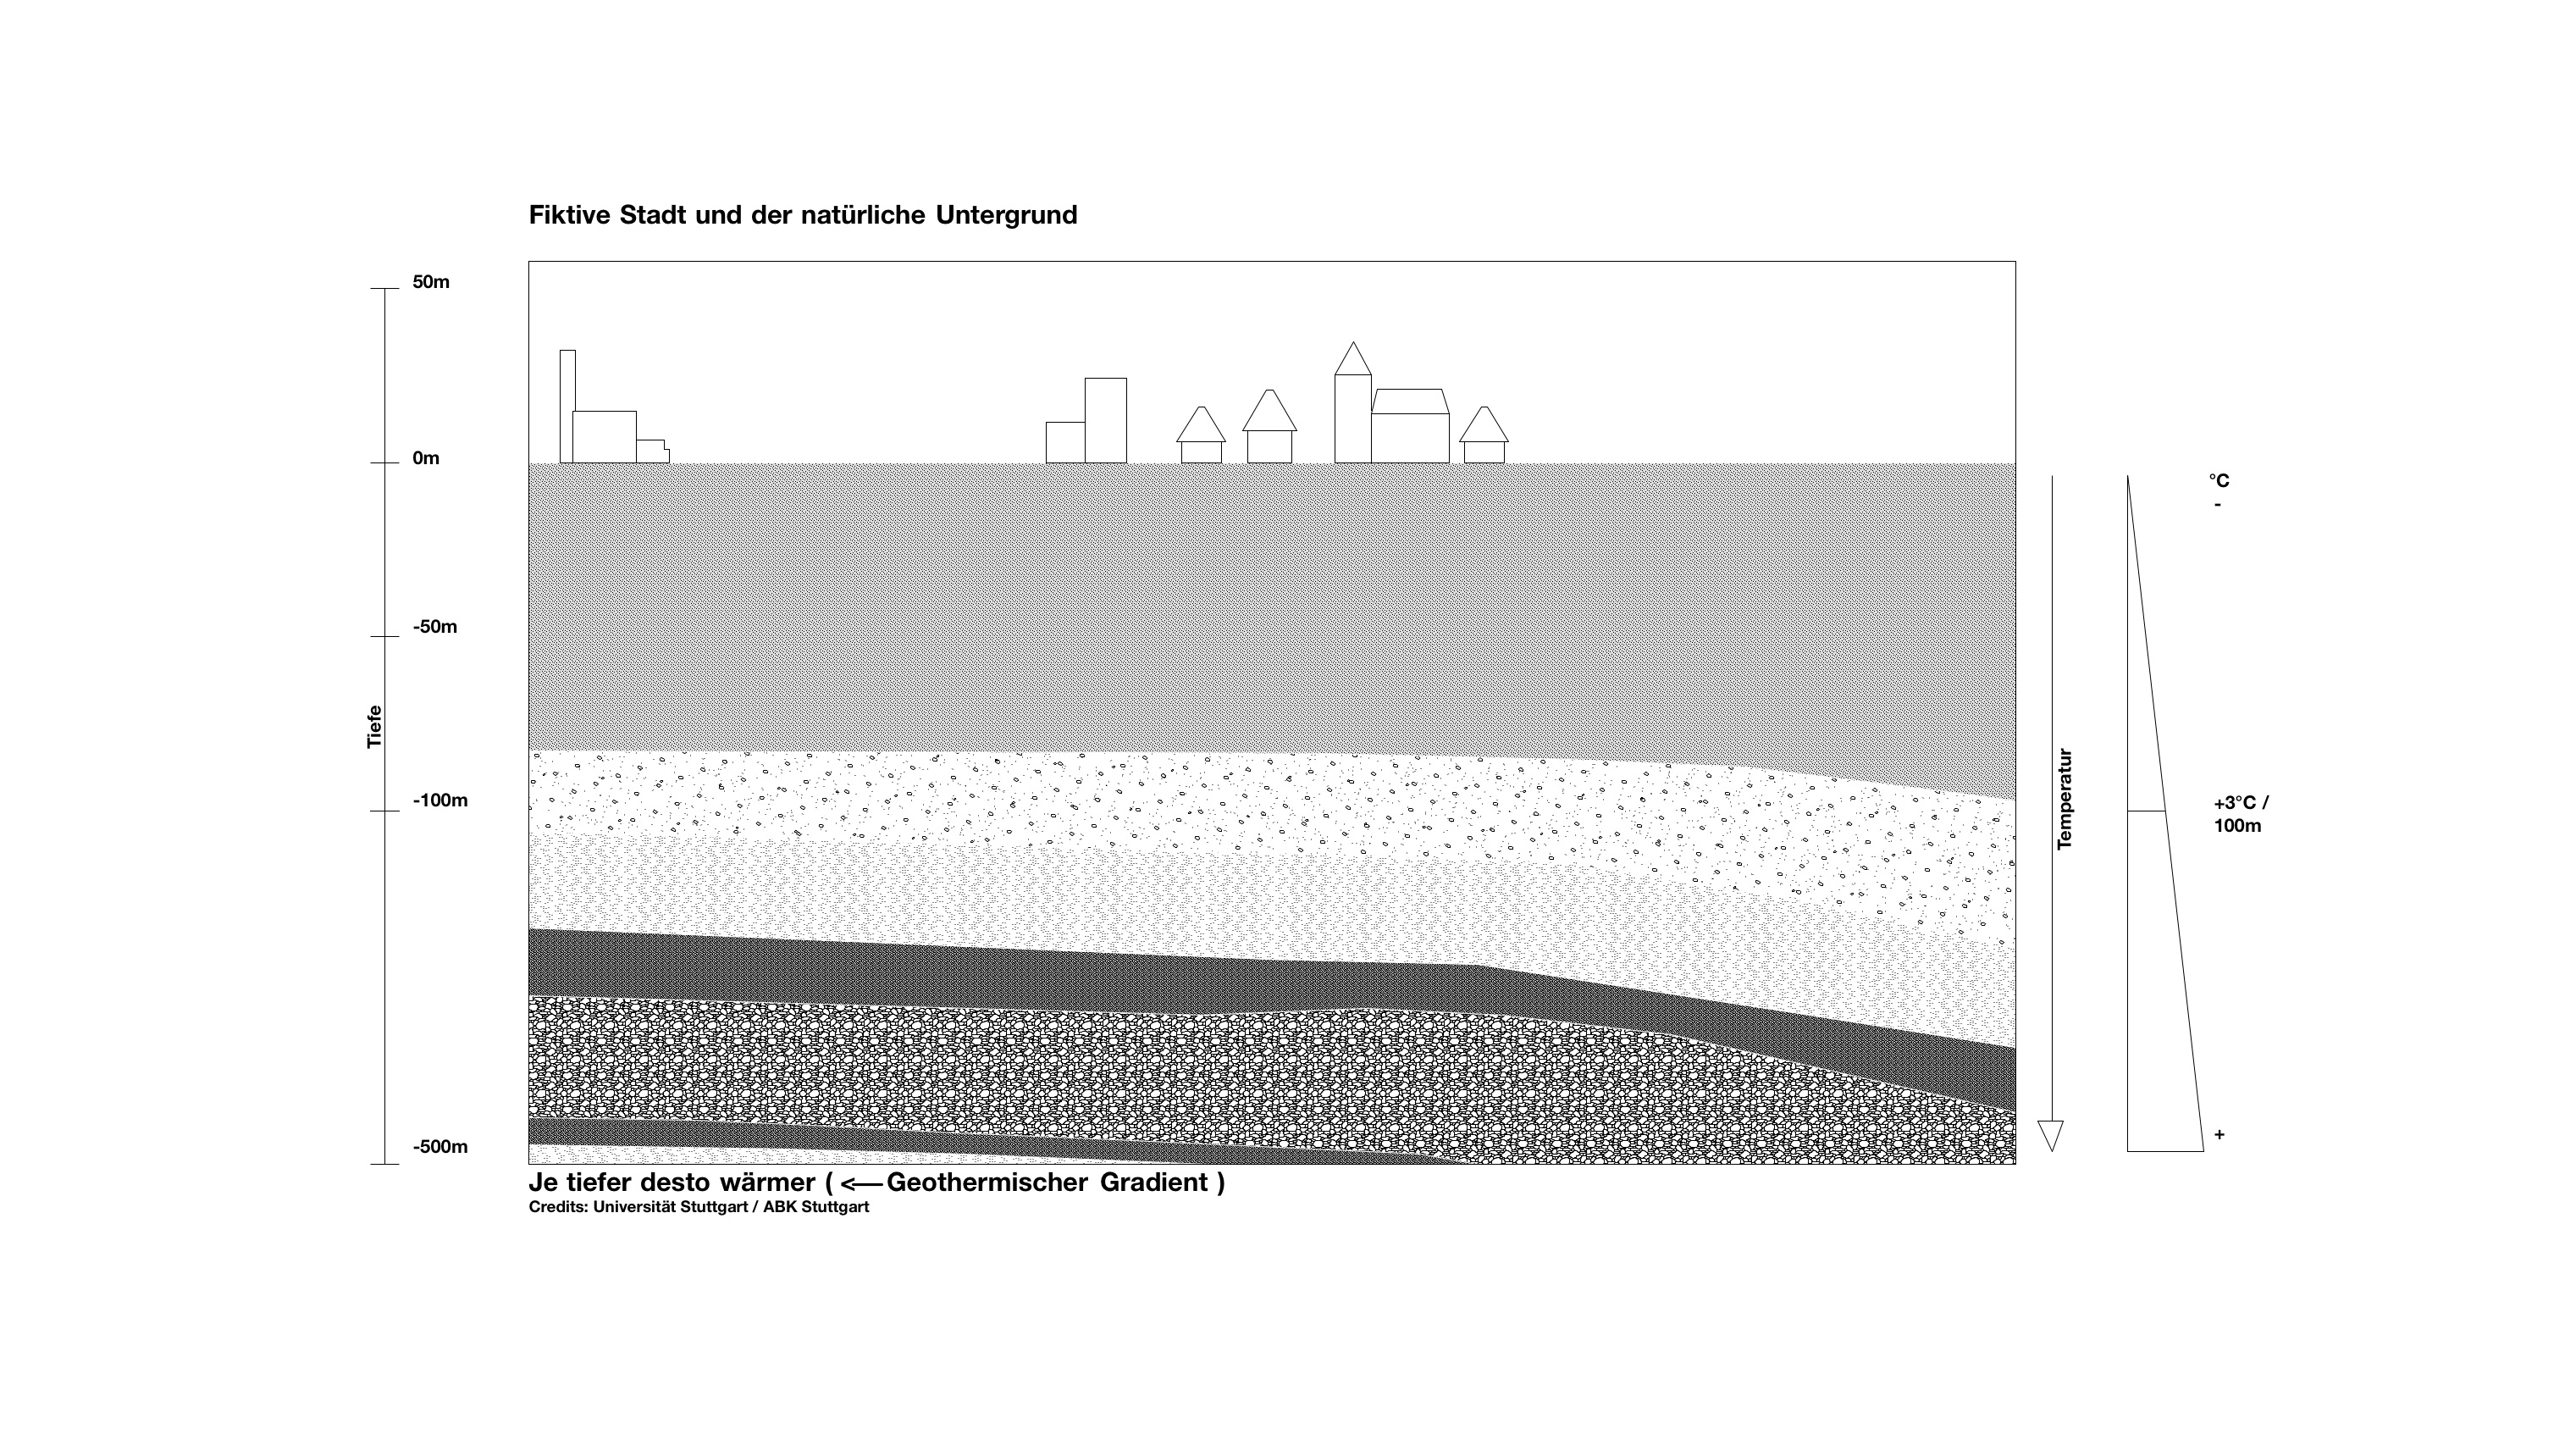
The temperature of the groundwater and the underground rocks increases in average by 3°C per 100 m depth. The temperature is therefore higher than the average ambient temperature, which is about 10°C in Germany.
Average ambient temperature + depth x 3 °C
At a depth of 2 km the temperature is already between 70 and 80 °C.
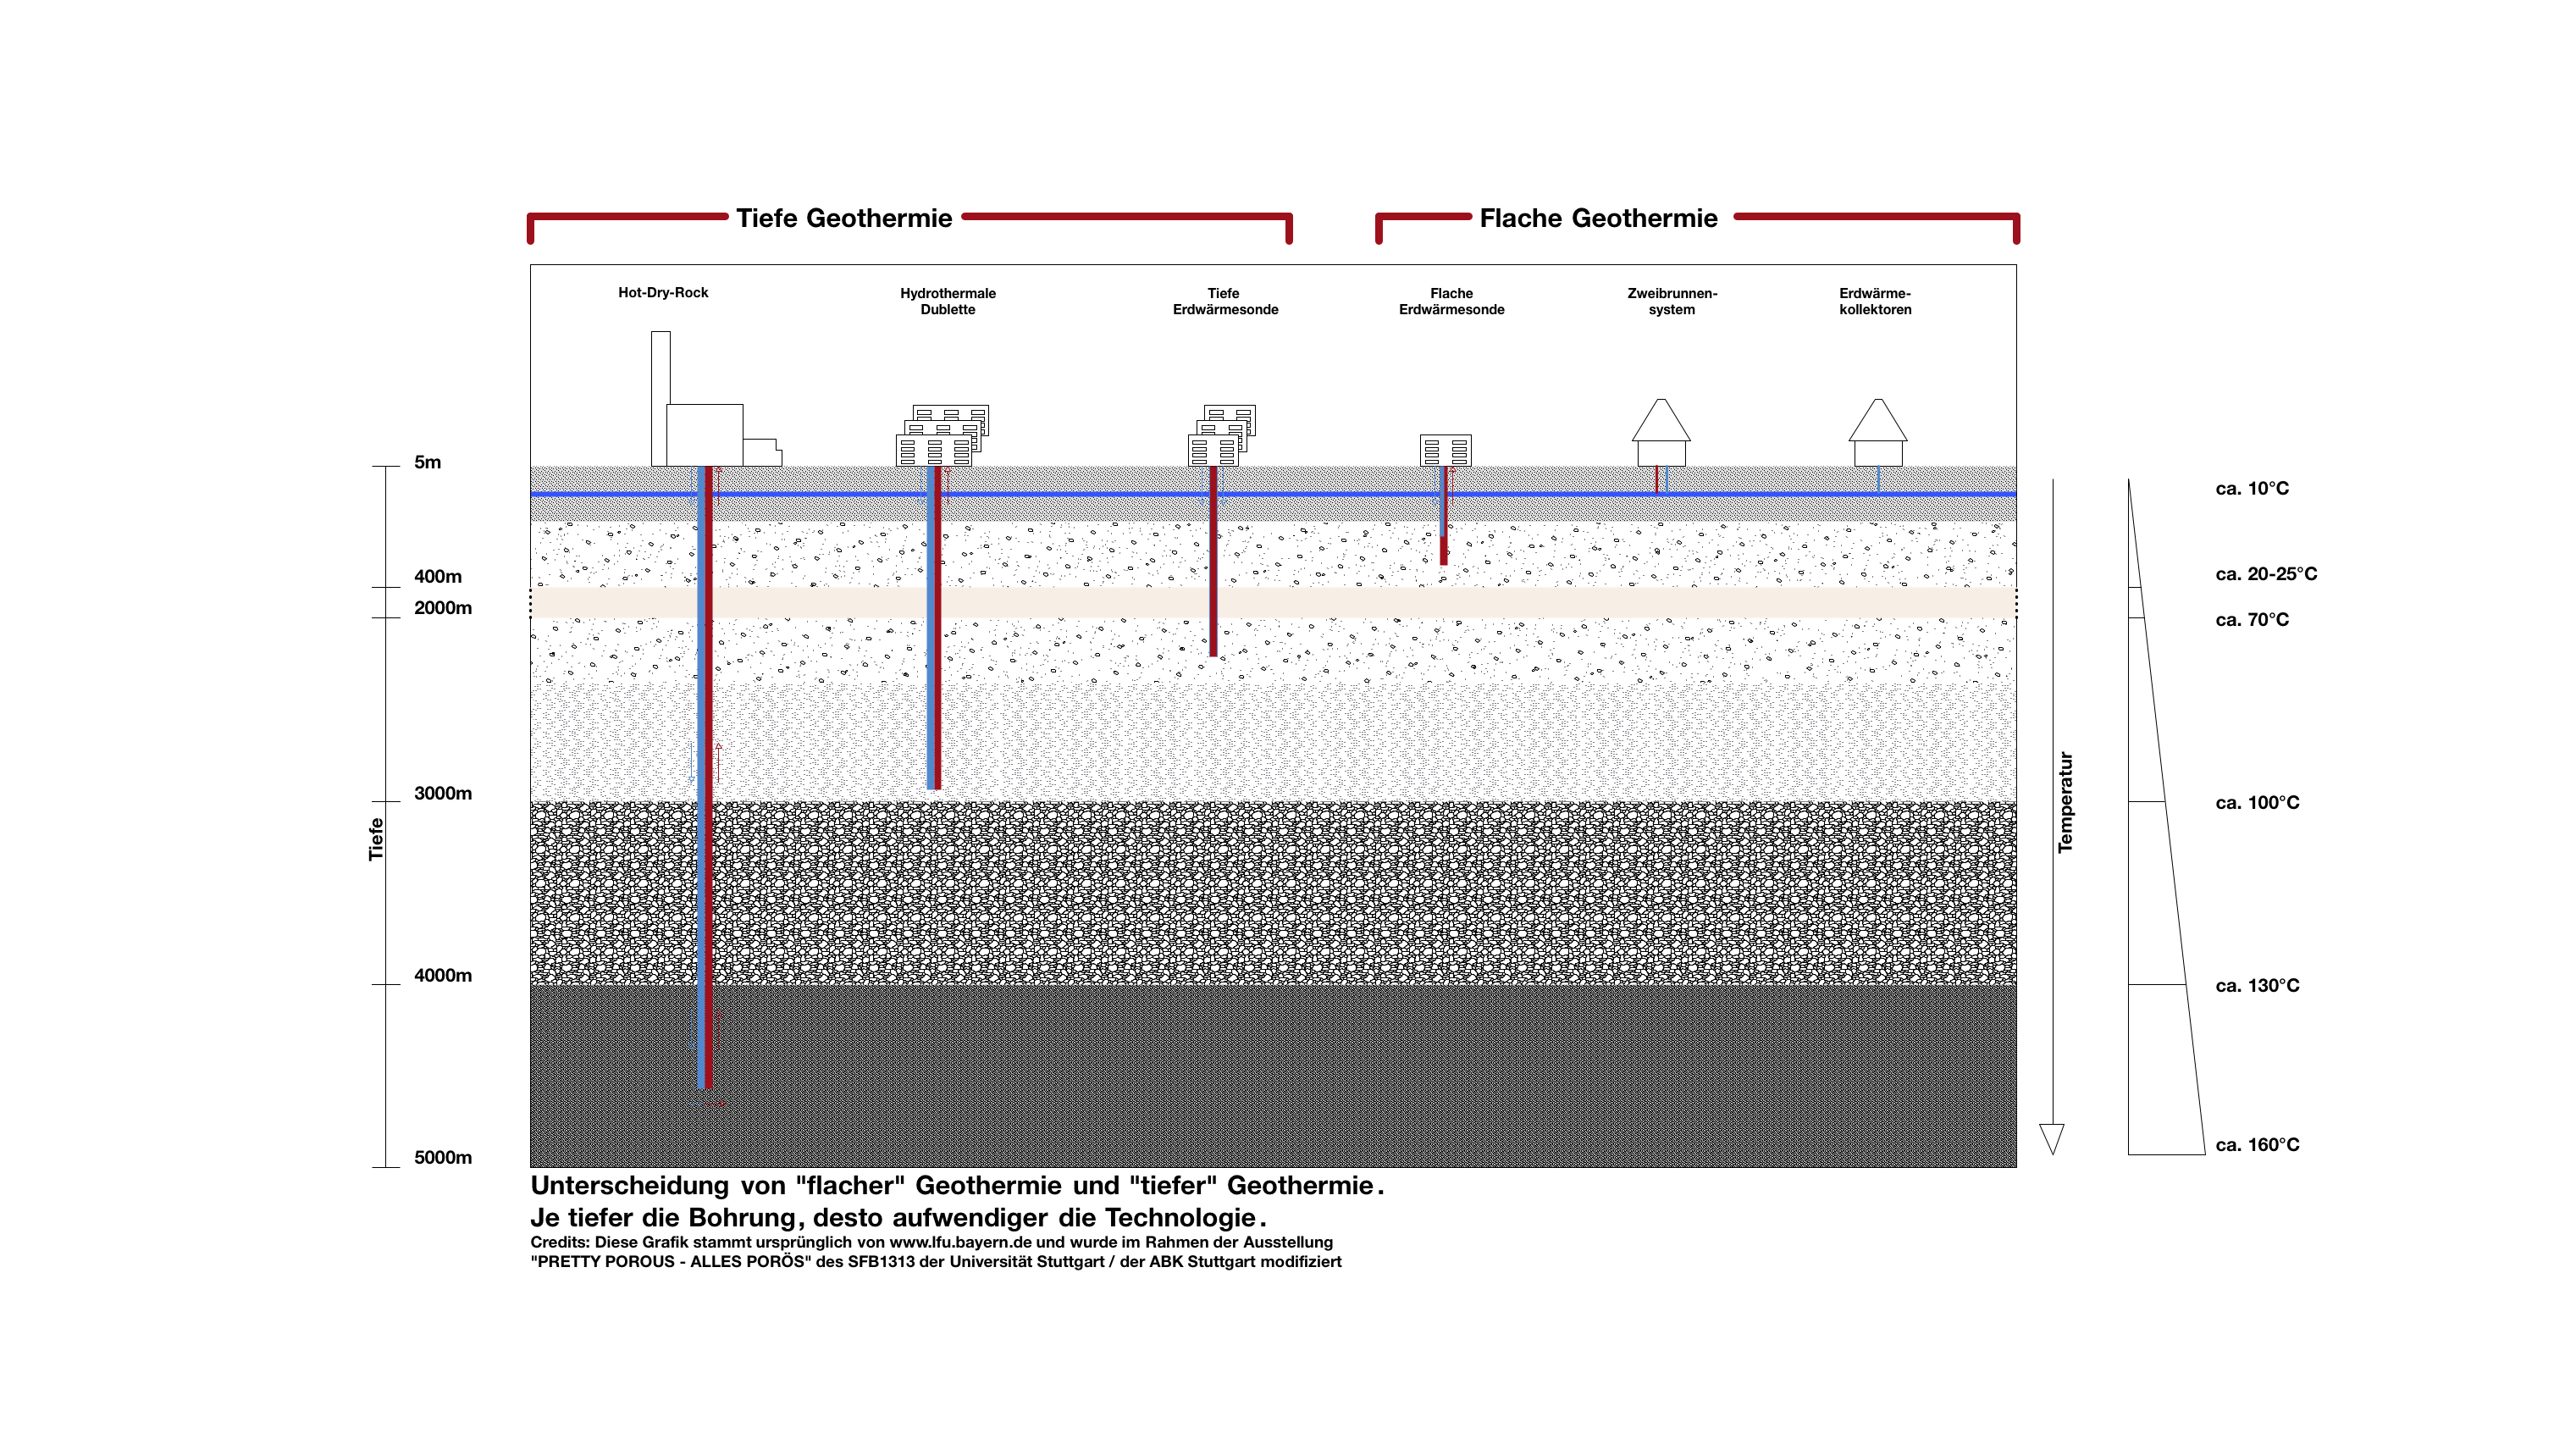
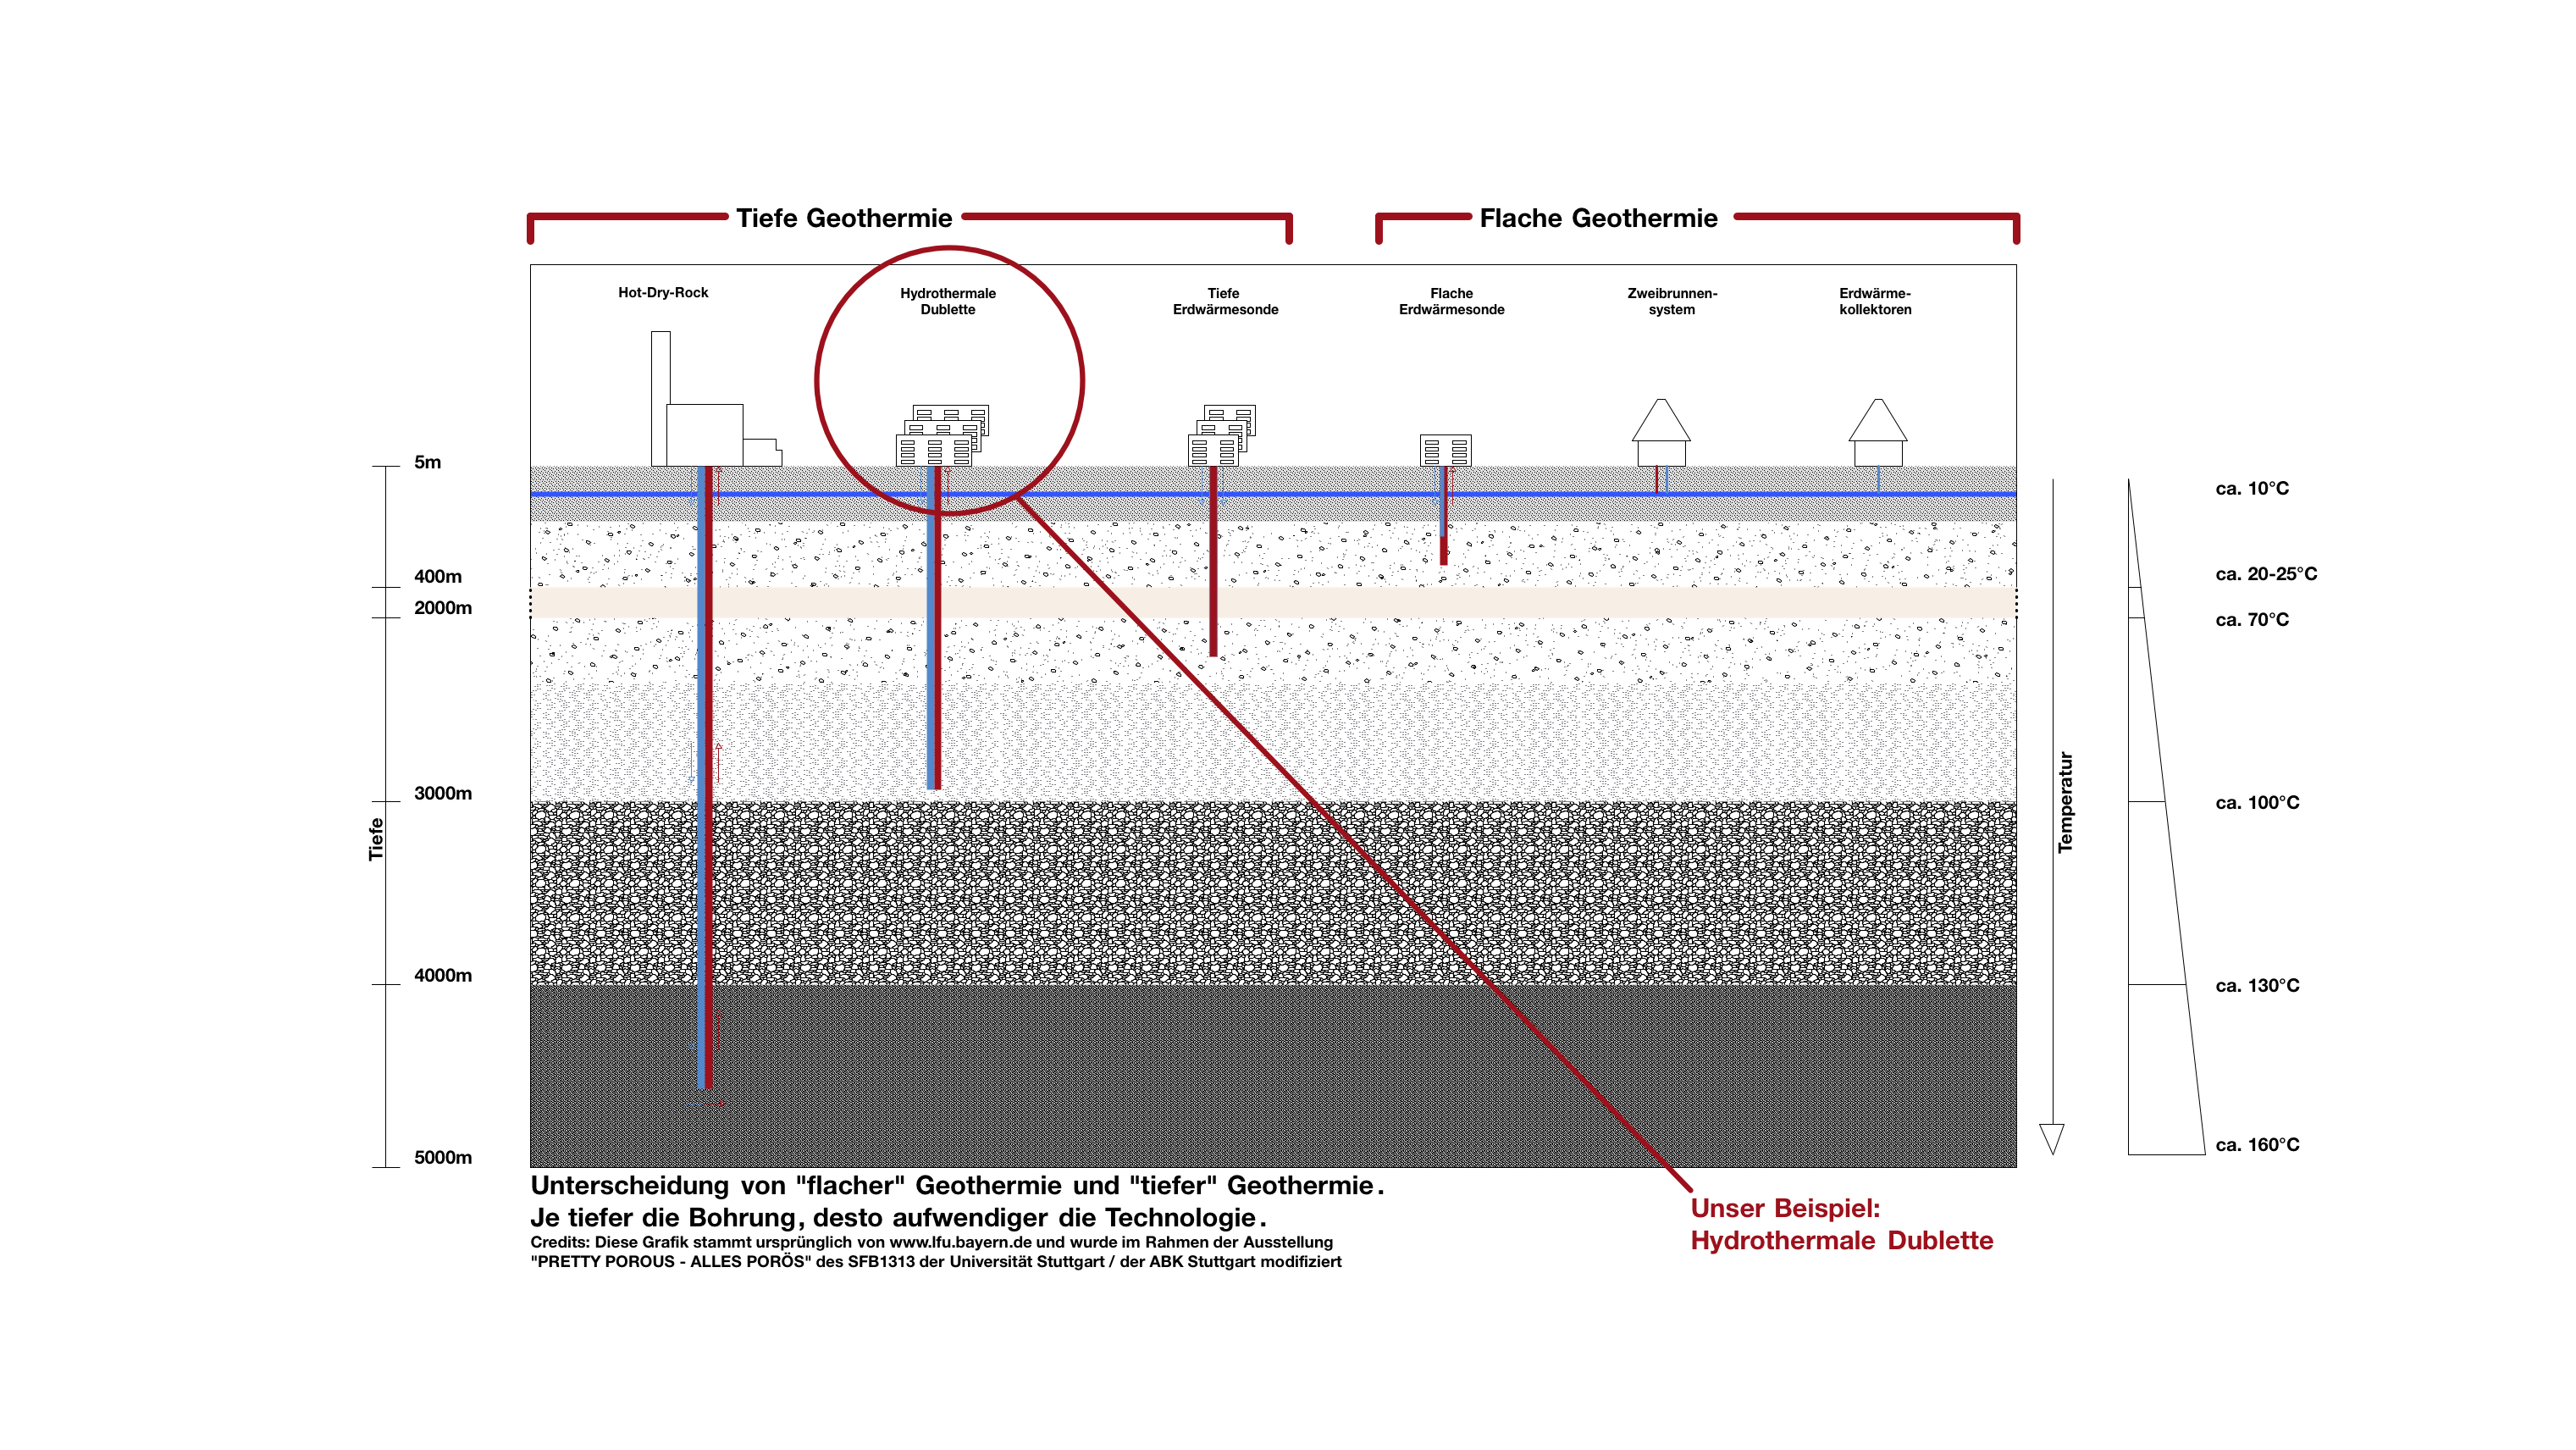
How does geothermal energy come to the surface?
Using groundwater for heating or for cooling requires appropriate technical systems. Production of geothermal energy up to a depth of 400 m is referred to as shallow geothermal energy while in greater depths it is denoted as deep geothermal energy.
How can the heat be used?
The underground heat can be used as energy source
For heating (winter): the groundwater can be used for heating buildings.
For generating electric current
Heat also can be injected or stored
For cooling (in summer): Groundwater can be used to cool buildings, streets or squares.
Carbon Capture and Storage (CCS) in the natural underground
Another example of the use of the natural subsoil is CO2 storage. Humans produce CO2 as a byproduct of energy production from fossil fuels, such as in powerplants, heating, airplanes and (non-electric) cars. We even breathe it out. When the CO2 is released in the atmosphere, it accumulates, and reduces radiation of energy back into space like in a greenhouse, which in turn may affect the climate.
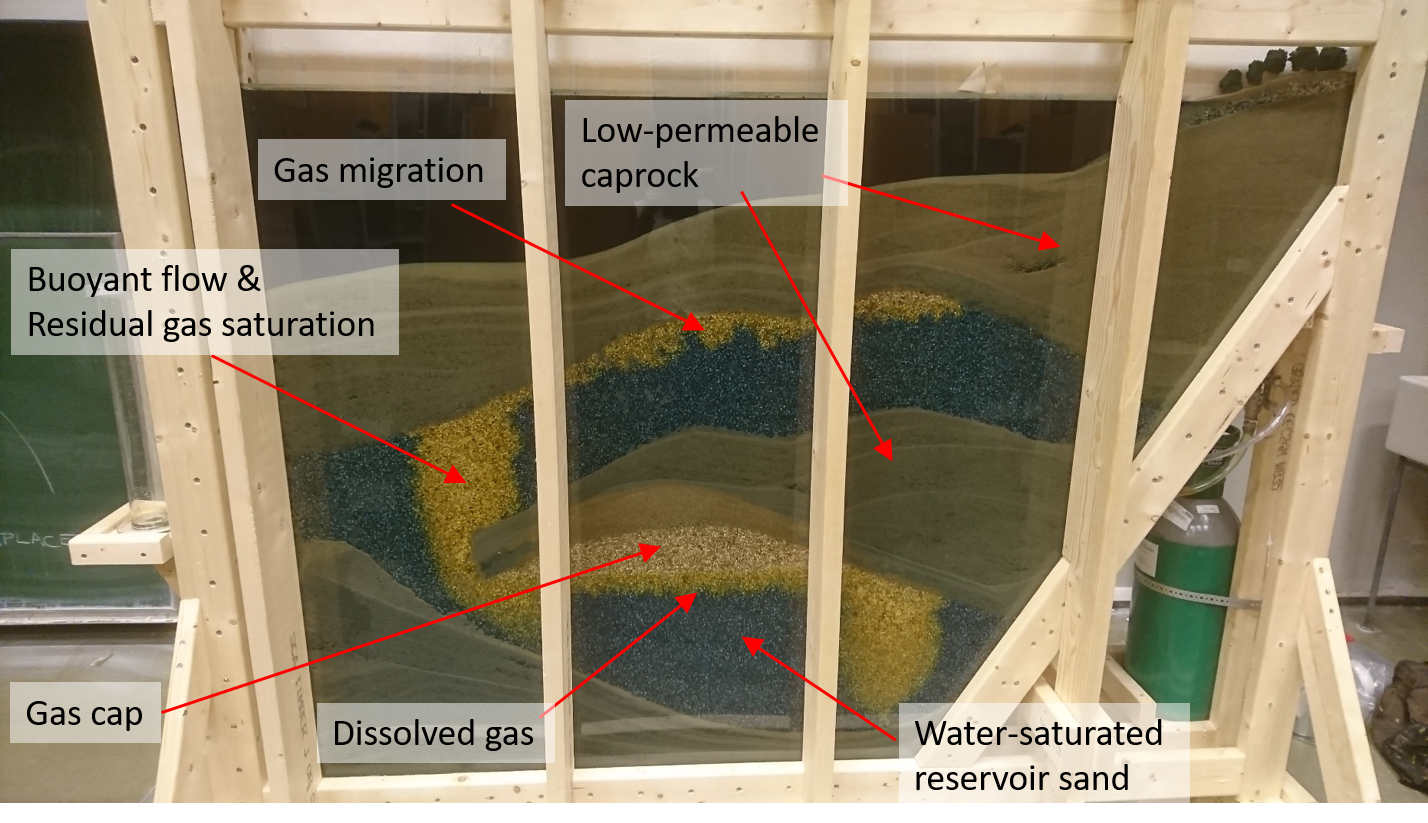
Credits: Prof. Dr. Jan M. Nordbotten, Bergen University (Norway)
This experiment has been created by the “Porous Media Group” of the University of Bergen in Norway. In the experiment, the researchers have created an illustrative cross-section of the North Sea, and show how injection of CO2 gas leads to accumulation under almost impermeable layers of fine sands. Over time, much of the CO2 dissolves into the water which always exists in subsurface sand layers.
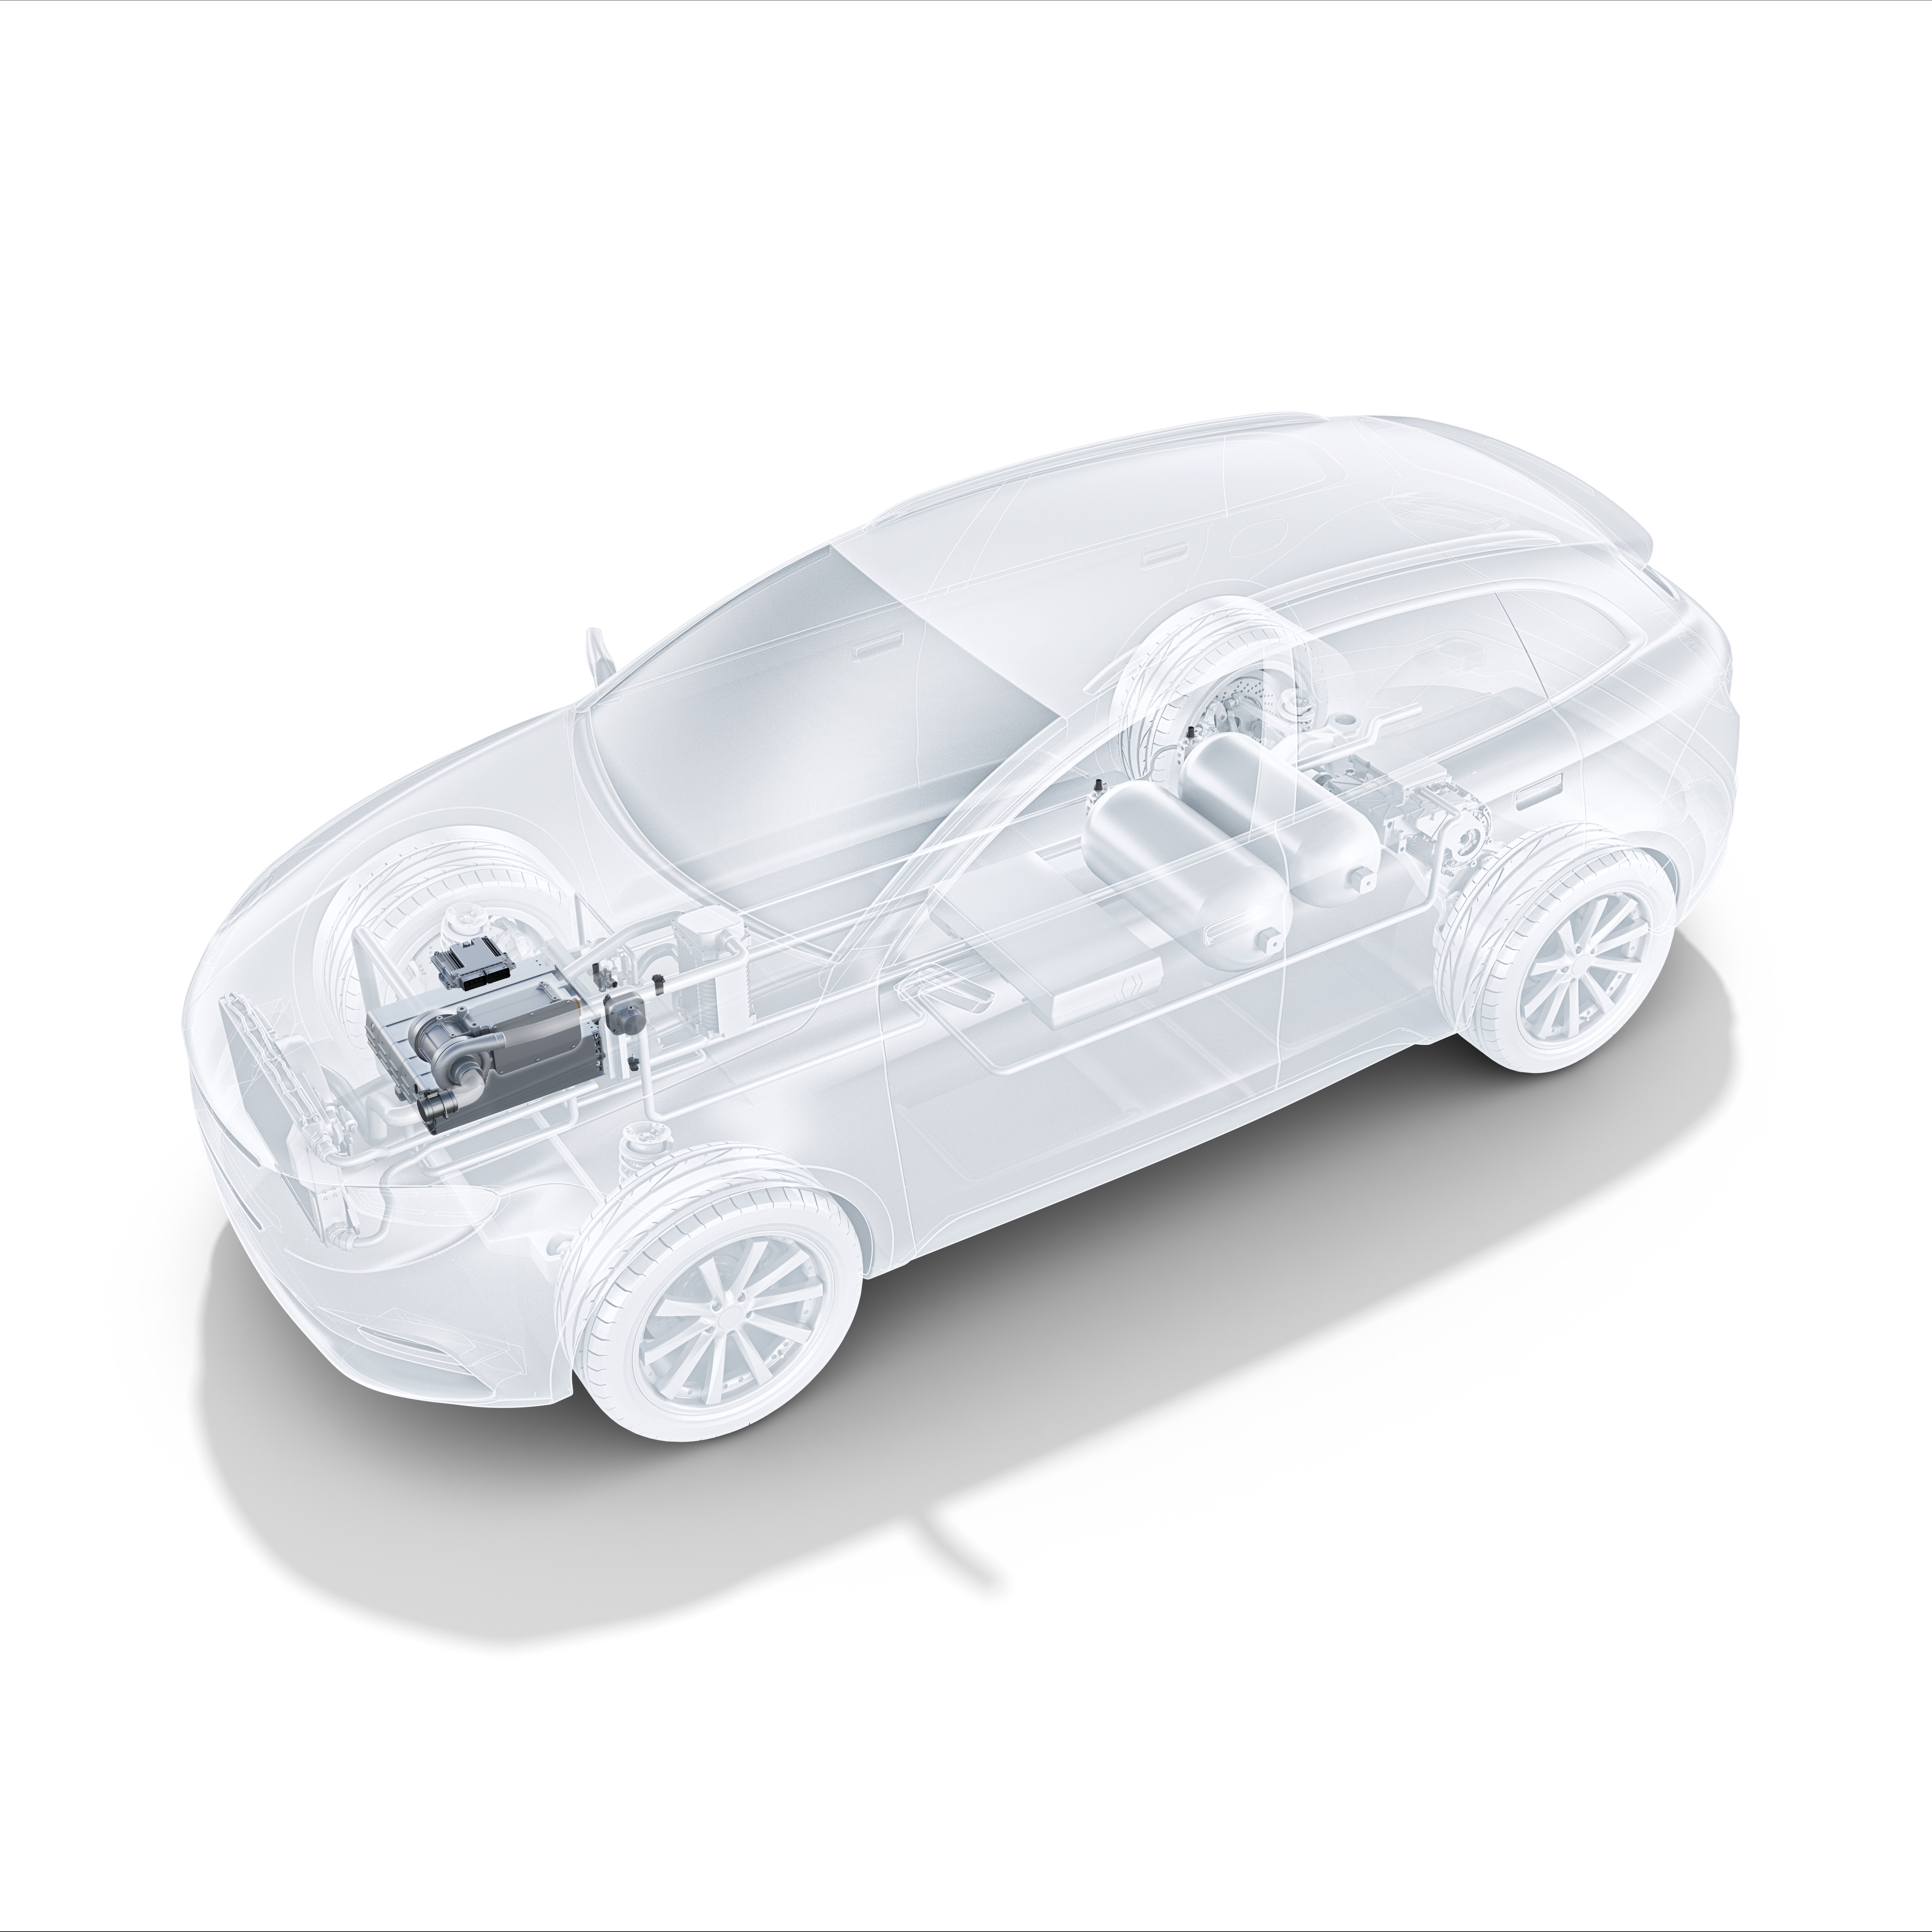
In the context of mobility change, the fuel cell is becoming more and more important in the automotive world. This technique allows for emission-free driving on a local level. For heavy vehicles in particular, it represents an attractive alternative to battery-powered vehicles.
The PEM (Polymer Electrolyte Membrane) fuel cell consists of multiple porous layers with different characteristics. To remain competitive, high efficiency and durability must be achieved at low cost. Simulations can help us to research the porous layers.
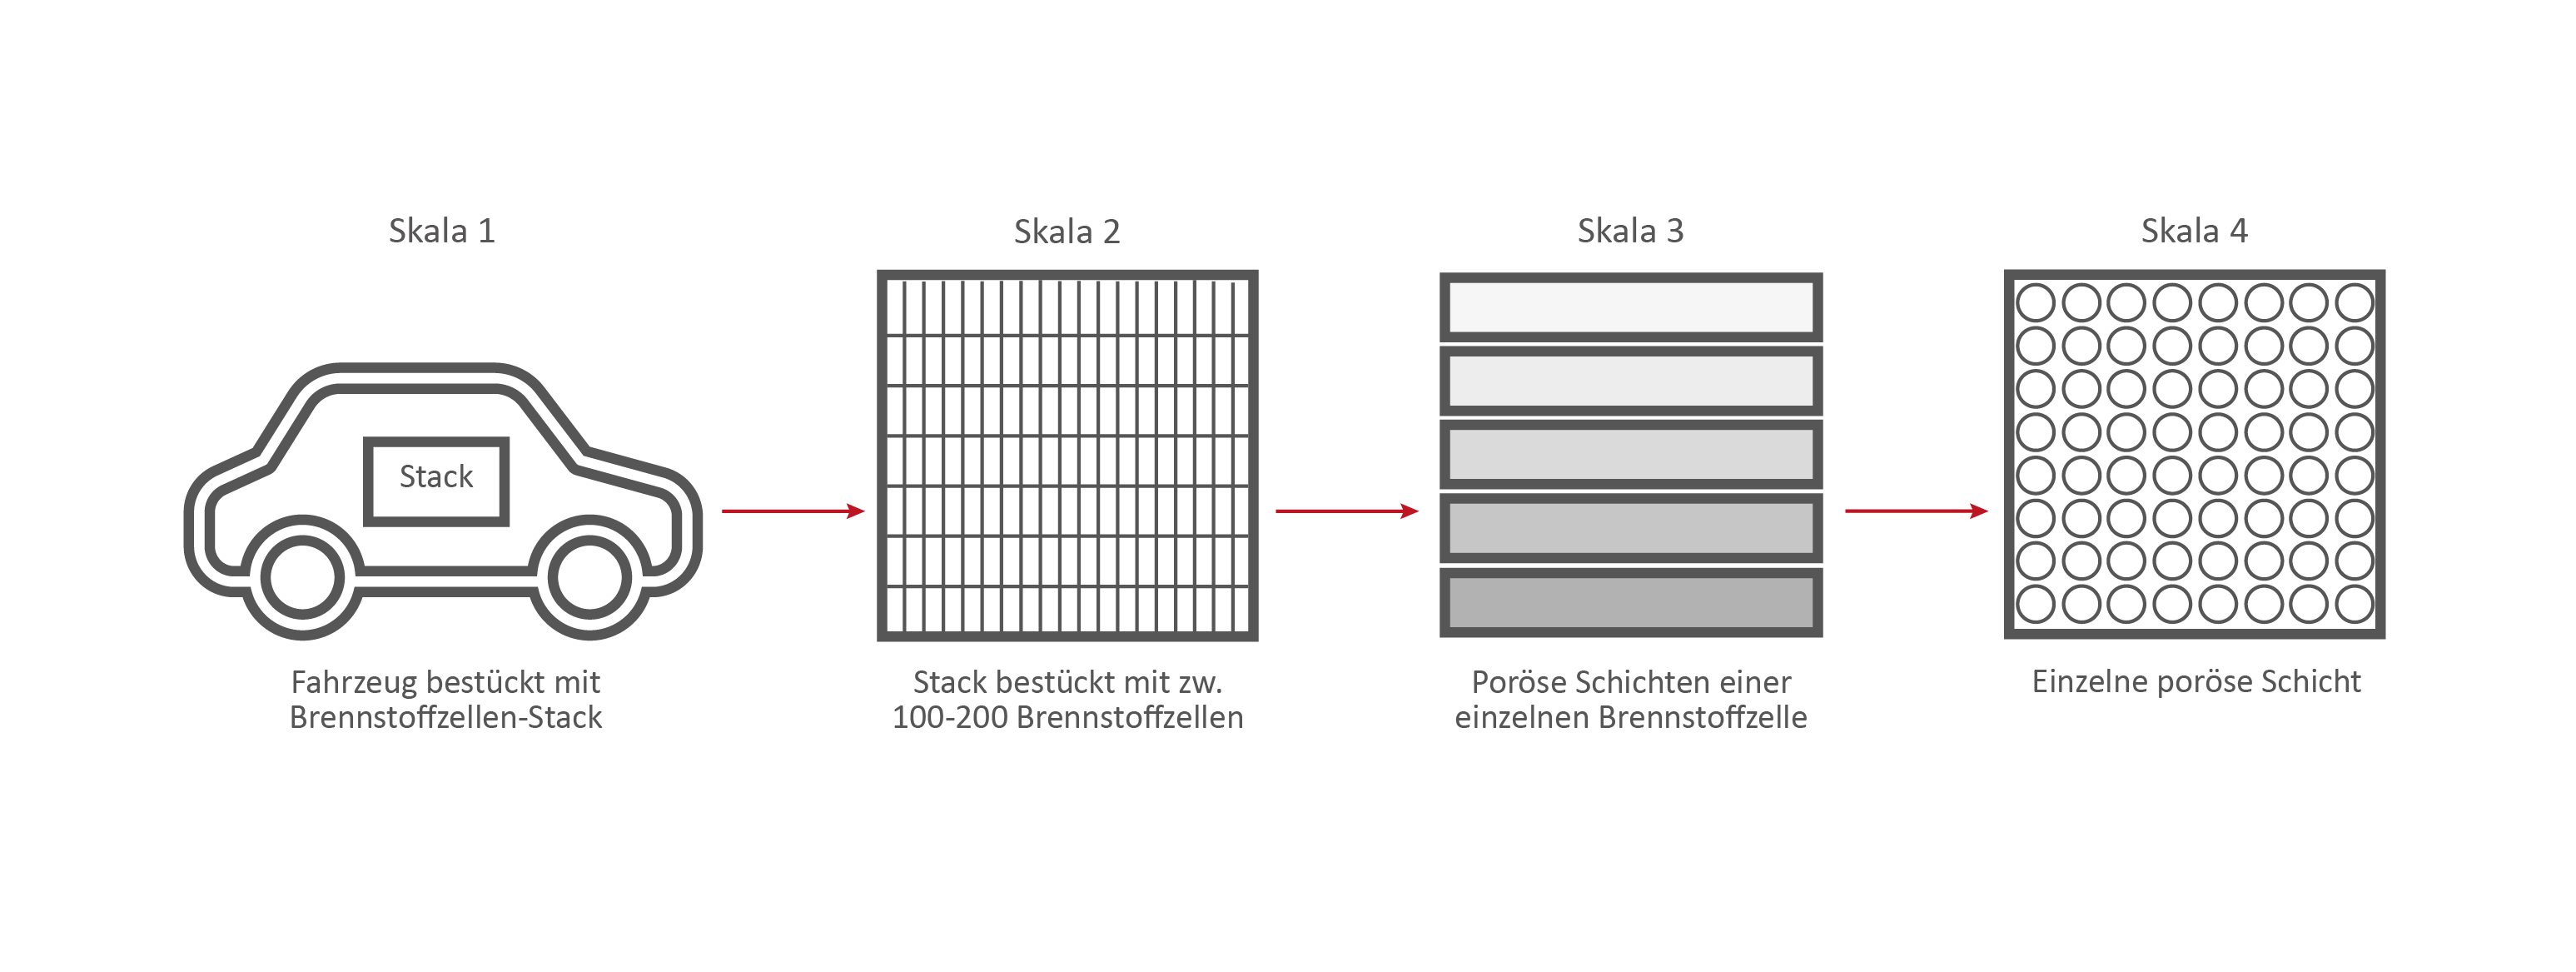
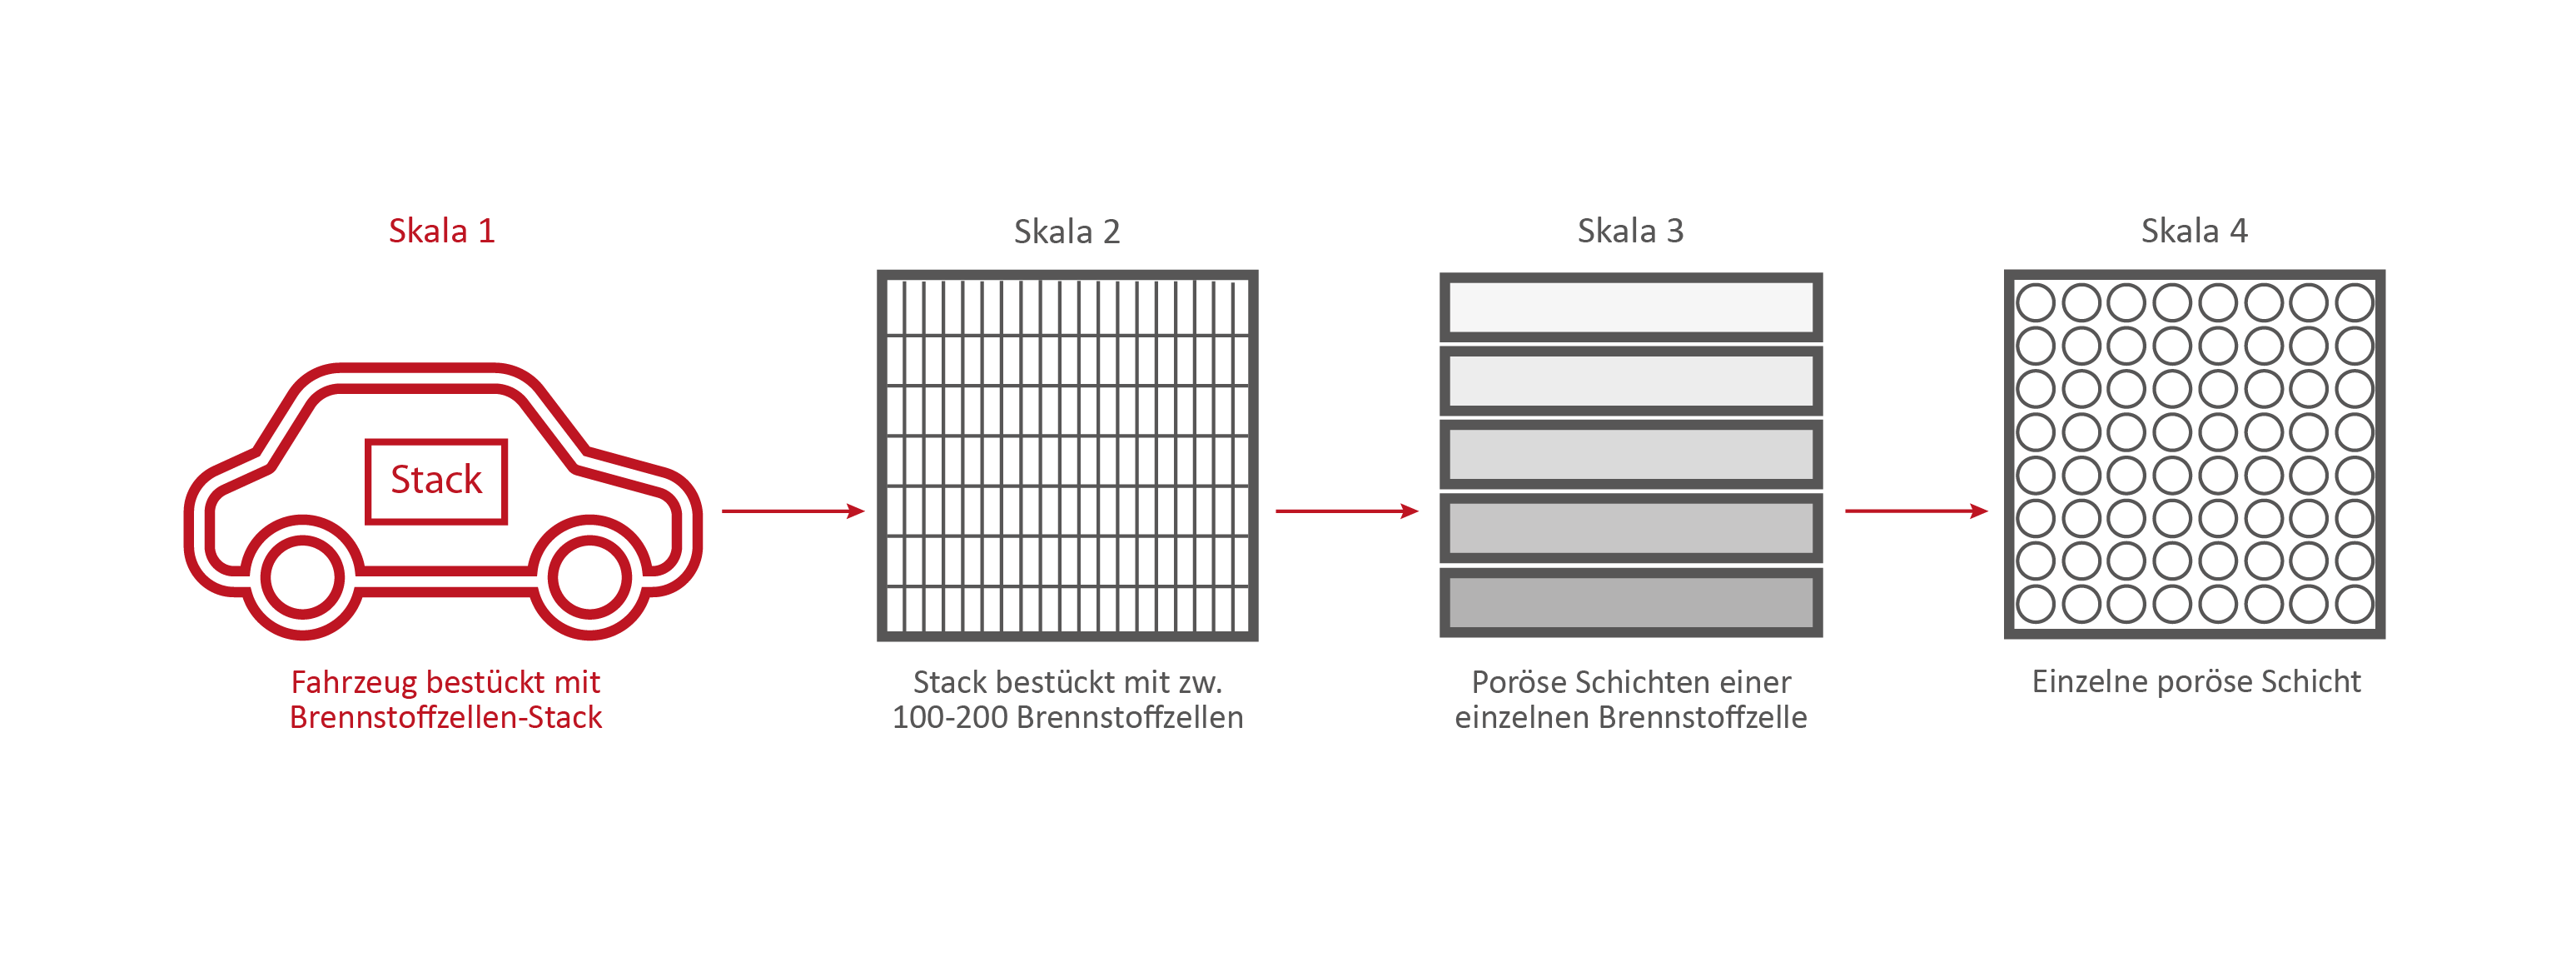
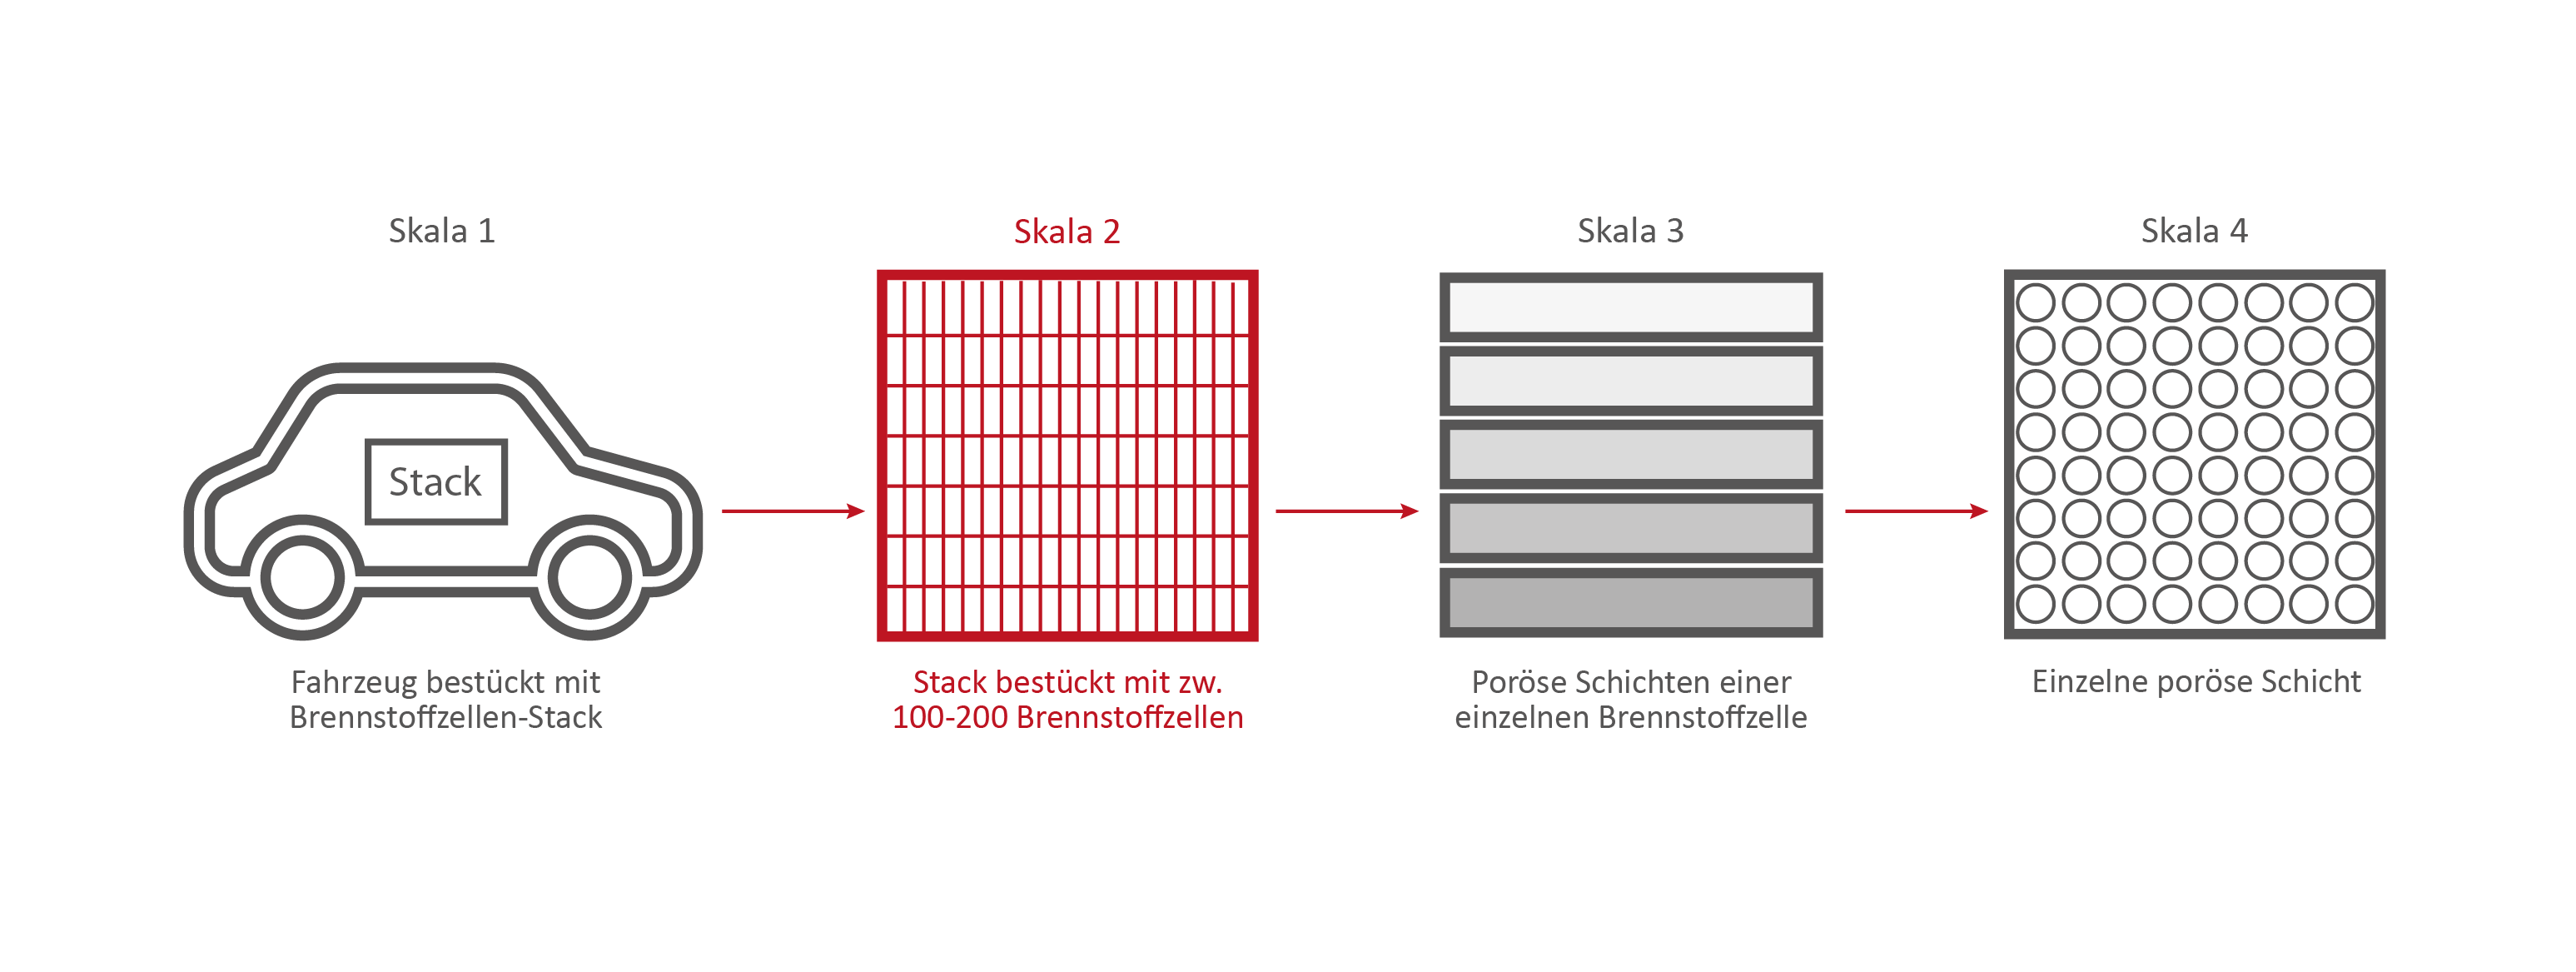
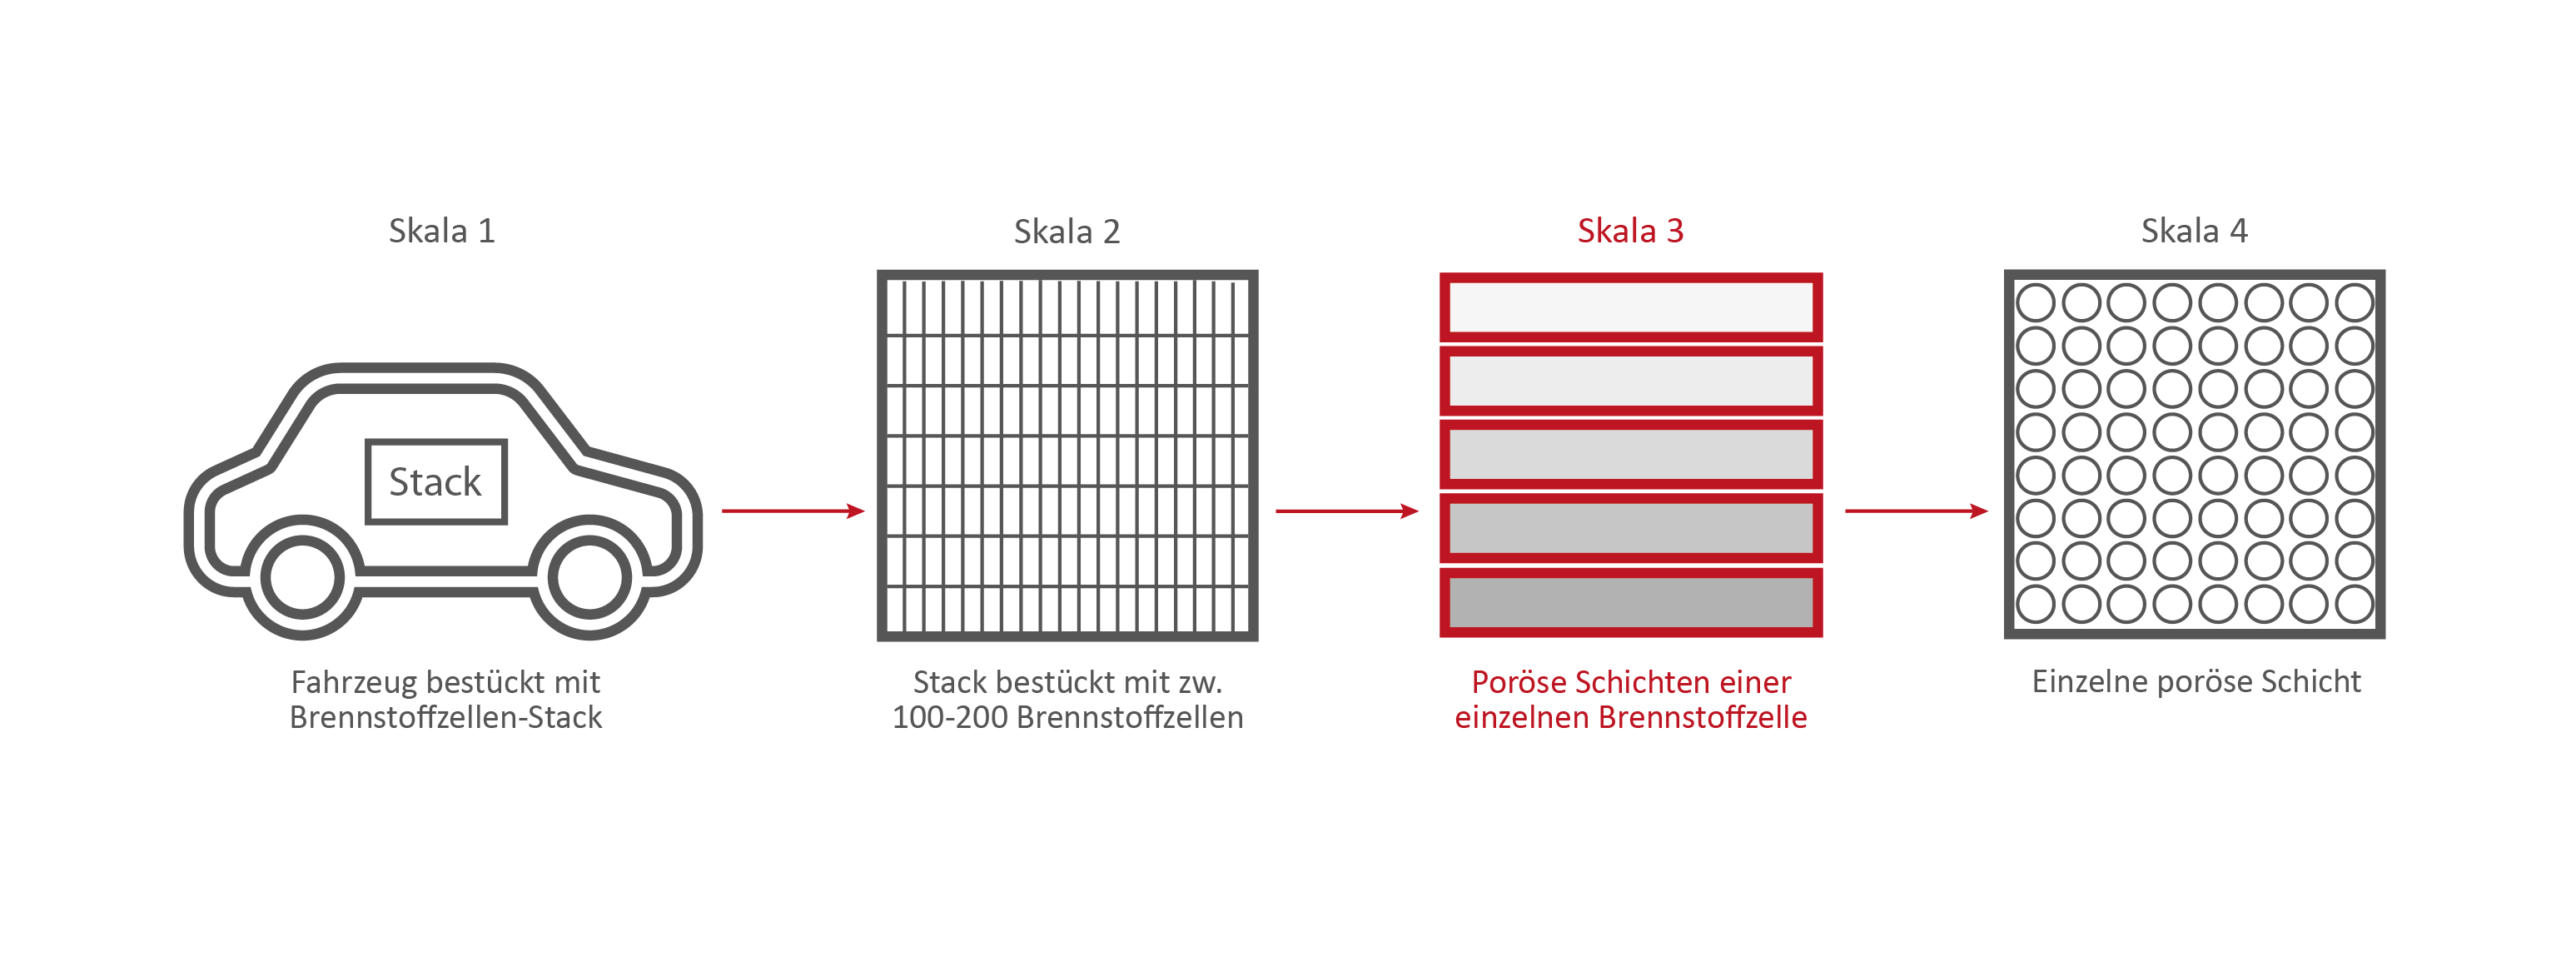
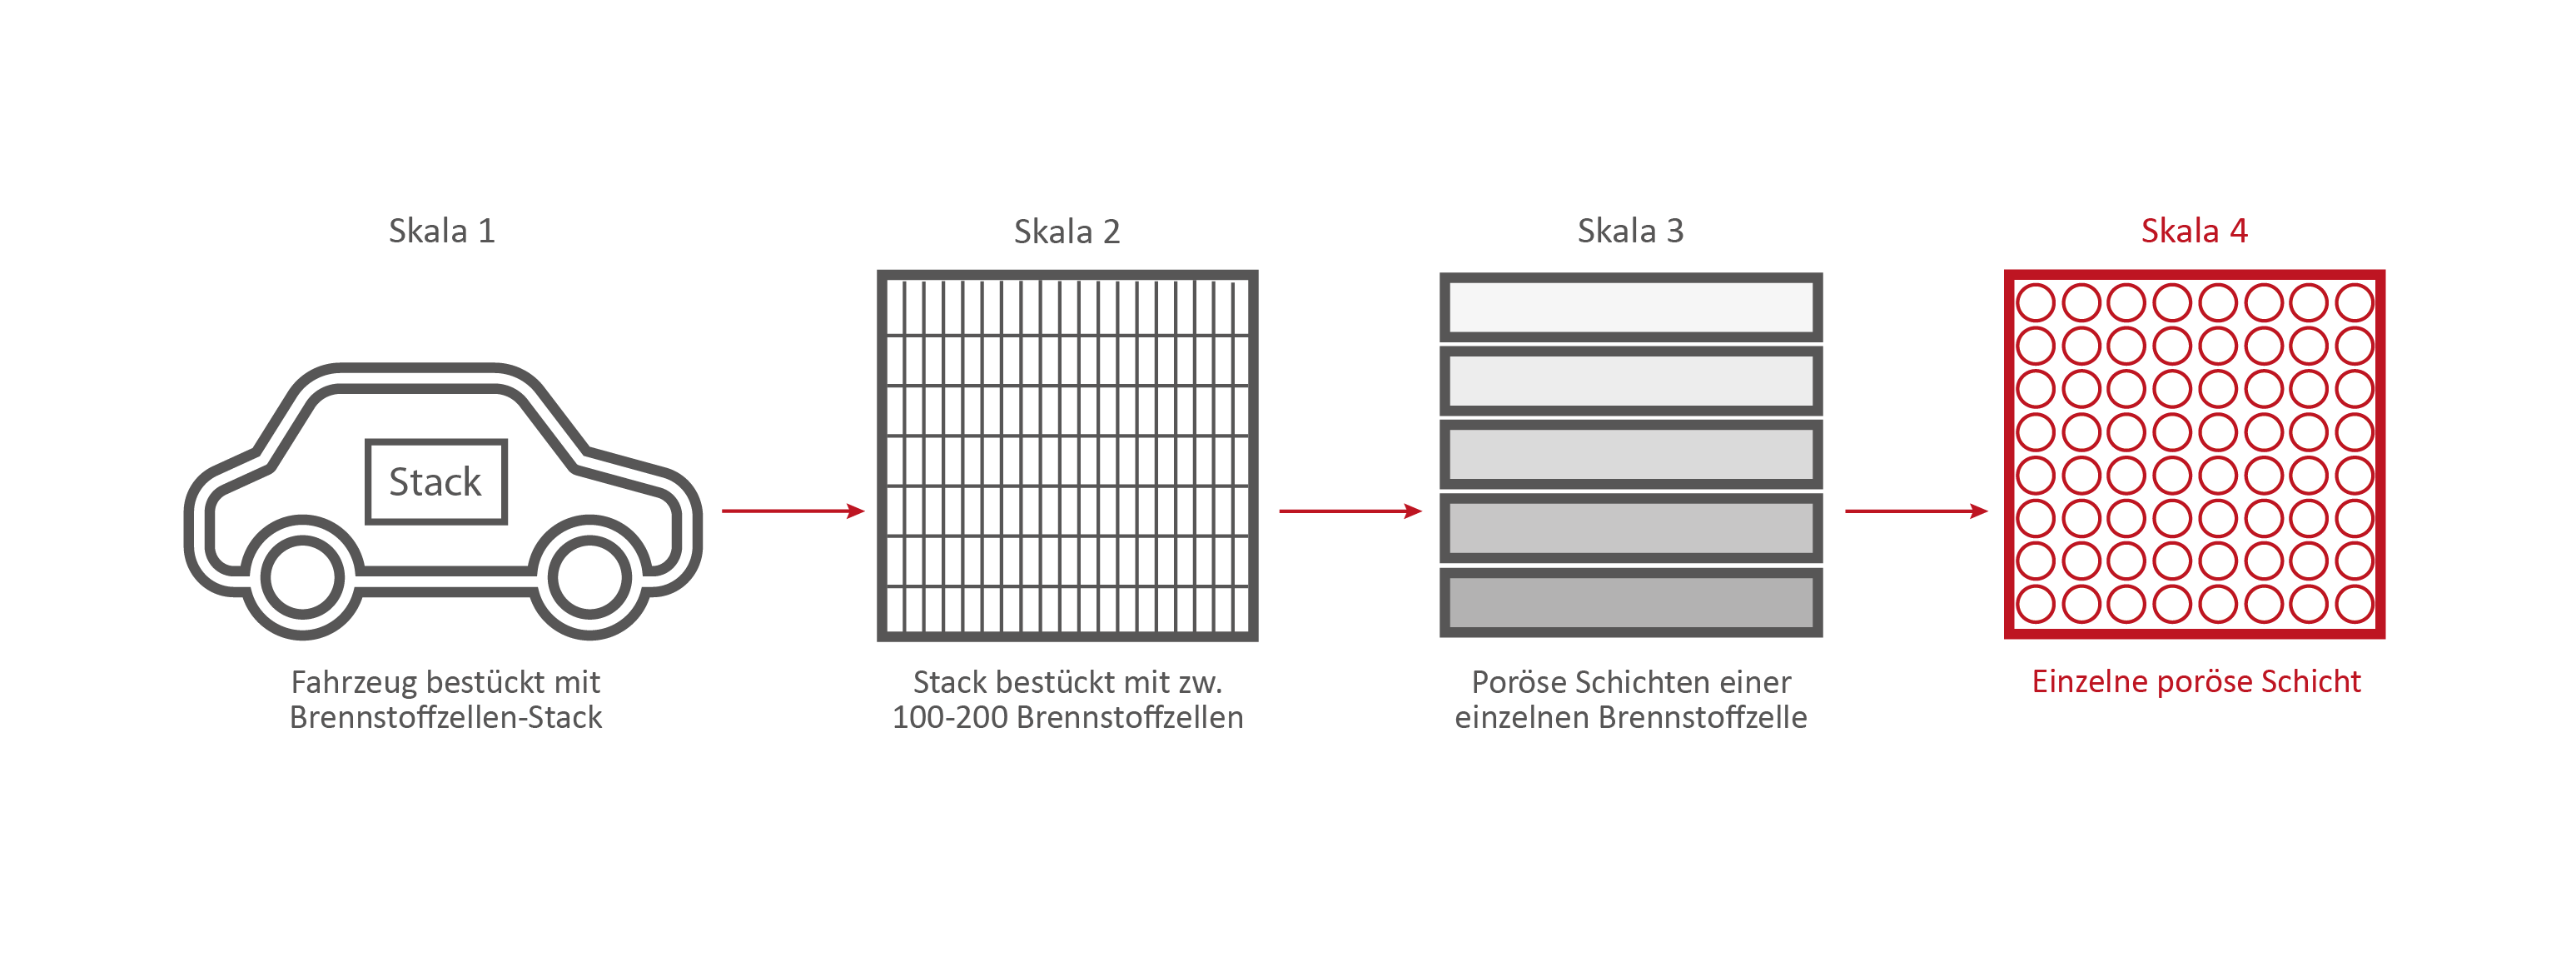
Efficient methods must be developed to describe and model the porous materials, the transport, and interactions of the porous layers. A fuel cell stack, used for example in a vehicle, can be divided into multiple scales (stack scale, full cell scale, representative volume inside the cell, pore scale). The transport processes in the fuel cell takes place on different scales. However, this method is not suitable for the simulation of complete cells or even entire fuel cell stacks due to the computing effort involved. For a precise representation, however, it is important to consider the relevant effects of the small-scale phenomena also on coarser scales. Therefore, intelligent methods must be found. However, to do this, the relevant effects must first be identified. To describe the interaction of the two-phase water-air-transport at the interface between the GDL (gas diffusion layer) and the gas distributor, in this project a pore network model is used. The transport processes are described on the pore scale. A major challenge here is the change of wettability from the hydrophobic GDL to the hydrophilic gas distributor and the resulting occurring phenomena. In addition to modelling on the pore scale, the frequency of the phenomena occurring must also be analyzed. With this information, a stochastically based model can finally be transferred to the full cell scale.
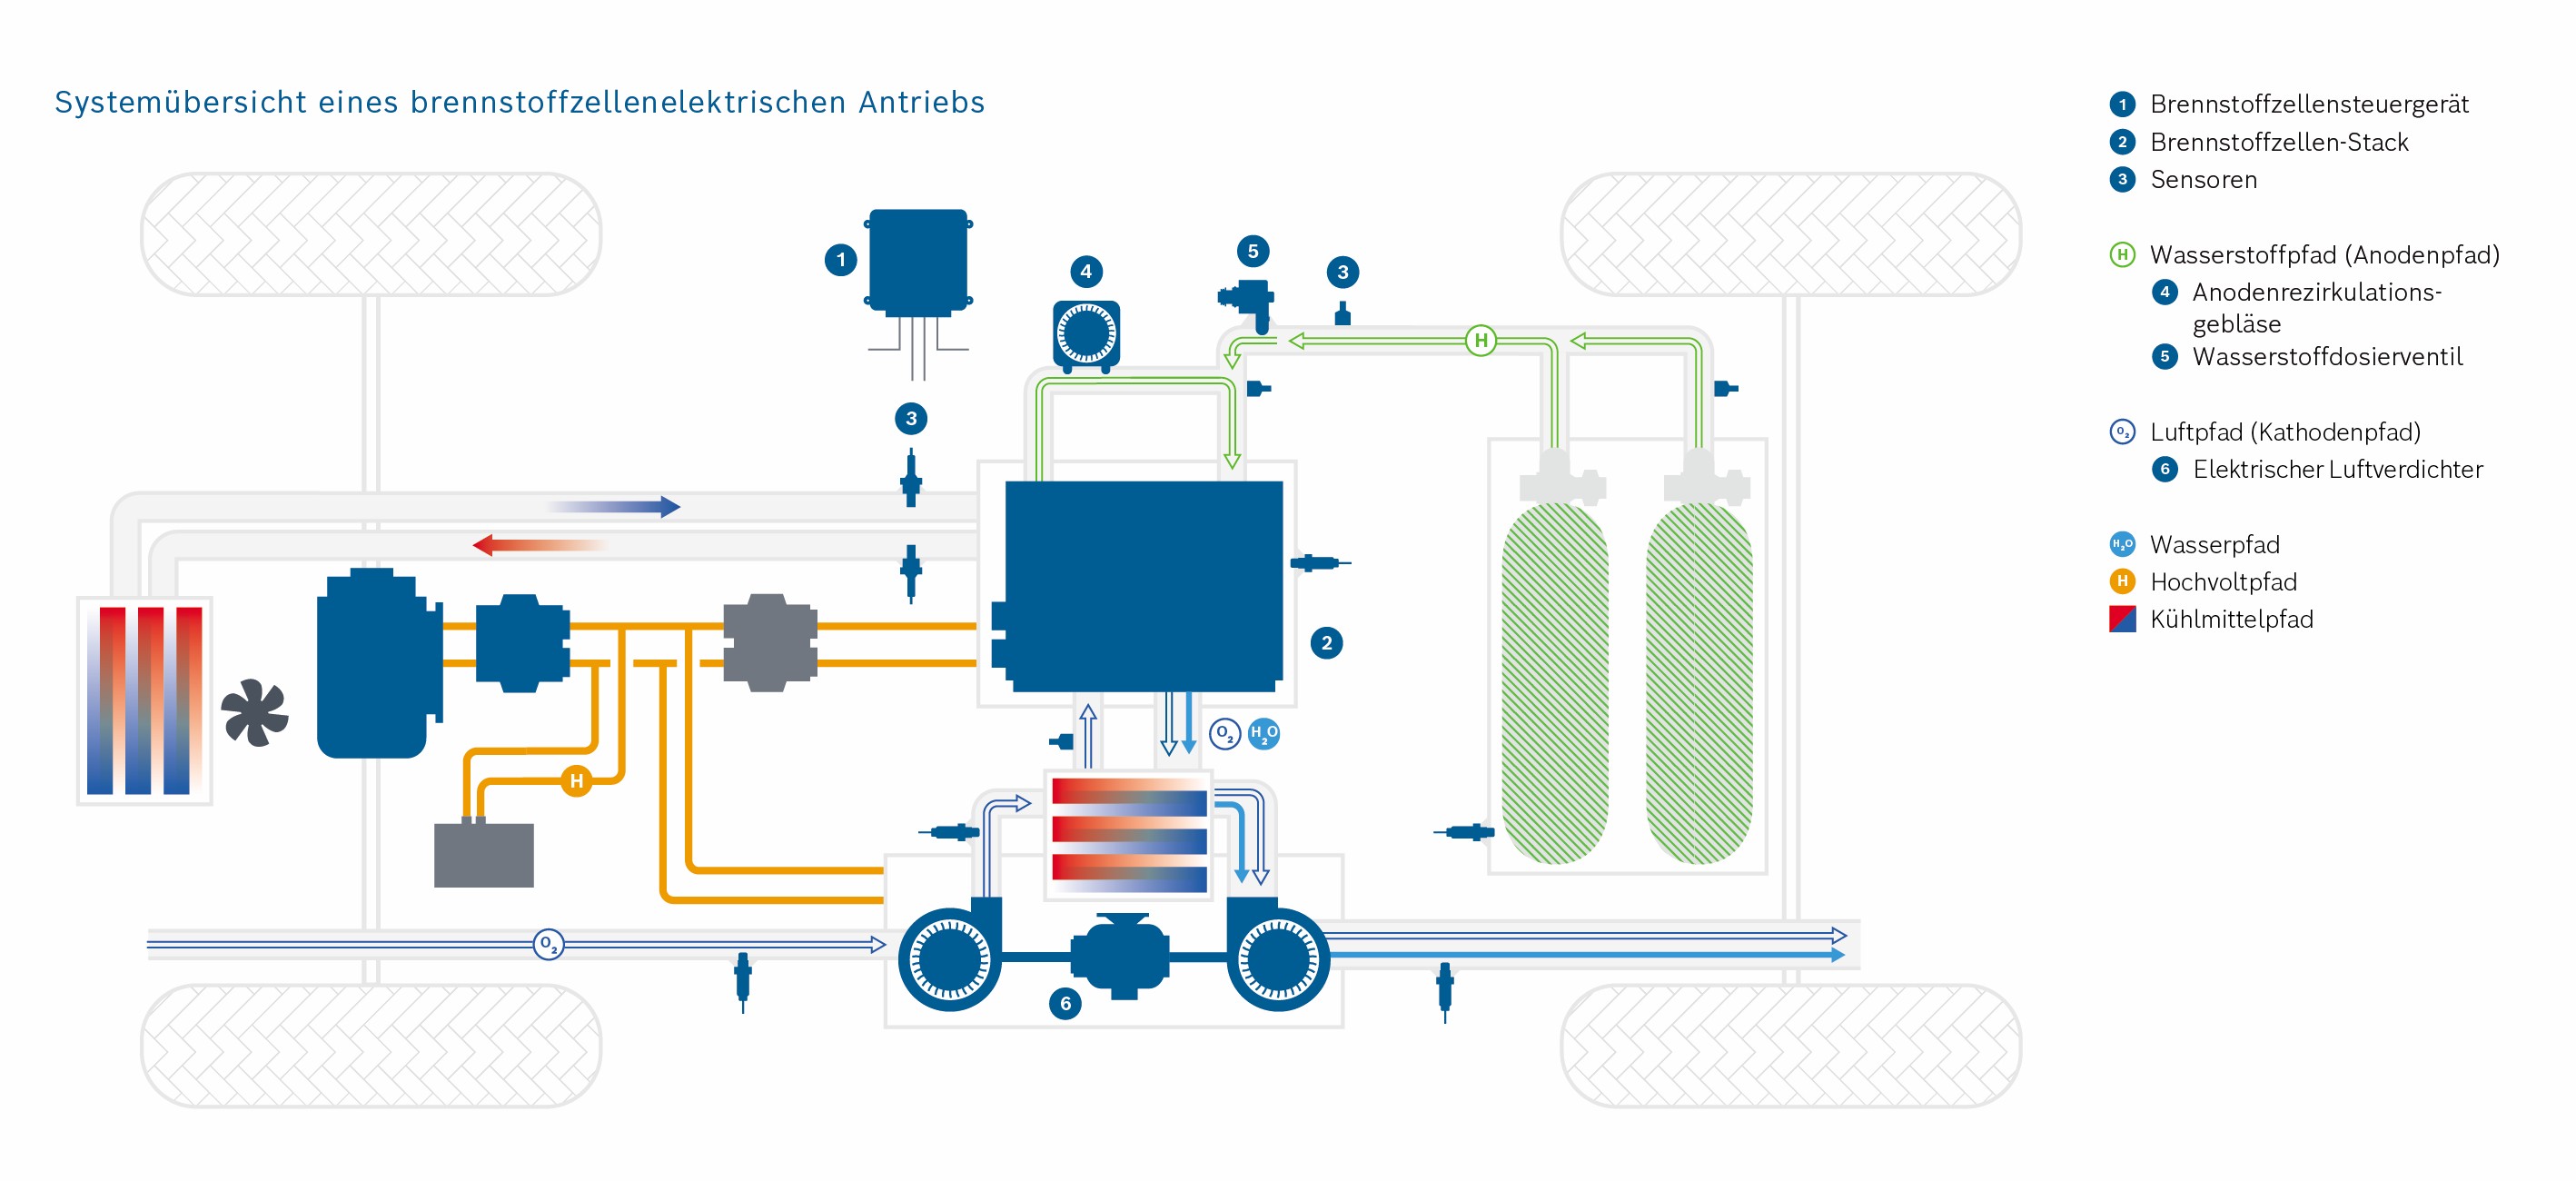
Explanation of the Cathode and Anode
The hydrogen is fed into the cell on the anode side and transported through the GDL and MPL. Hydrogen molecules are split into protons and electrons in the CL, the catalyst layer. This is the anode reaction in the fuel cell. The electrons are transported via the MPL, GDL and the anode gas distributor into the electrical circuit and to the consumer (e.g. electric motor). The protons reach the cathode side of the fuel cell by passing the proton permeable PEM layer. On the cathode side there is a mirrored stack of the porous layers. Oxygen is transported into the cell by the air via the gas distributor and distributed homogeneously on the catalyst layer via the GDL and MPL. There, the oxygen molecules react with the protons which have passed through the membrane into the cathode catalyst layer. During this cathode reaction, electrons are consumed, which enter the cathode from the electrical circuit.
The reaction of protons, electrons and oxygen molecules produces water and heat. Both must be transported out of the cell via the porous layers on the cathode side.
If the water cannot be removed, too many water molecules accumulate in the fuel cell. This leads to a high condensation rate. If there is too much liquid water on the cathode side, the paths through which the oxygen can reach the catalyst layer are blocked. This can lead to a reduction in performance.
If the heat cannot be dissipated, this leads to fuel cell damage. At elevated temperatures, reactions take place in the catalyst layers, which should not take place there and which damage the material. The oxidation processes lead to premature “ageing” of the fuel cell.
Scale 1: The vehicle
Credits: University of Stuttgart / SFB 1313
Credits: Bosch GmbH
Credits: Bosch GmbH
Scale 2: The Fuel Cell Stack
Credits: University of Stuttgart / SFB 1313
Credits: Bosch GmbH
Credits: Bosch GmbH

Credits: University of Stuttgart / SFB 1313
This stack contains several hundred stacked fuel cells. The fuel cell stack generates the electrical energy that the vehicle needs.
Simulating processes in the fuel cell
Simulations are important in the research of fuel cells because they help to make processes in the fuel cell visible. With their help, researchers can understand the function of the porous layers. They understand how the transport of water, oxygen and hydrogen happens and whether they have to optimize the layers. Should they use a different material or structure? The knowledge they generate from the simulations can, for example, help to reduce costs during the vehicle production process.
Credits: University of Stuttgart / SFB 1313 / Cynthia Michalkowski
This example shows a model of a fuel cell GDL layer. With the help of this model it is possible to simulate the water proportion in the pores. The water is pressed through the porous layer and exits at the marked points
Scale 3: The individual fuel cell and its porous layers
Credits: University of Stuttgart / SFB 1313
The research on the PEM (polymer electrolyte membrane) fuel cell serves as an example. It consists of nine porous and non-porous layers and materials with different properties.
A single fuell cell is very thin, less than 2 cm thick and about 30 cm long.
If the PEM fuel cell is opened, the nine different layers become visible.
Credits: University of Stuttgart / SFB 1313 / Cynthia Michalkowski
Enumeration of the 9 layers of the PEM fuel cell
1) Anode side: Gas channels – Channel structure (not porous). Material: metal or ceramics
2) Anode side: GDL = Gas Diffusion Layer (porous). Material: coated carbon fiber
3) Anode side: MPL = Membrane Polymer Layer (porous). Material: coated carbon particles/grains
4) Anode side: CL = Catalyst Layer (nano-porous). Very fine scale, but the transport processes are the same as in a porous medium. Material: carbon particle and Ionomer chains with platinum as catalyze
5) PEM = Polymer Electrolyte Membrane (more or less porous). The transport is chemical rather than comparable to a porous medium. Material: Nafion
6) Cathode side: CL – see anode side
7) Cathode side: MPL – see anode side
8) Cathode side: GDL – see anode side
9) Cathode side: Gas channel. Classical channel structure (not porous), but can also be expanded metal or similar material that can be interpreted as a porous medium. Material: metal or ceramics.
Hydrogen (H2) and oxygen (O2) (from the air) pass through the porous layers of the fuel cell and finally react to water (H2O) that is transported out of the cell. A “transport” of hydrogen and oxygen through the porous layers of the fuel cell takes place.
Reaction equation of water: 2 H2 + O2 ⇌ 2 H2O
This reaction and the interaction of the various systems in the vehicle generate electrical energy, which ultimately drives the vehicle.
In-depth text simulation:
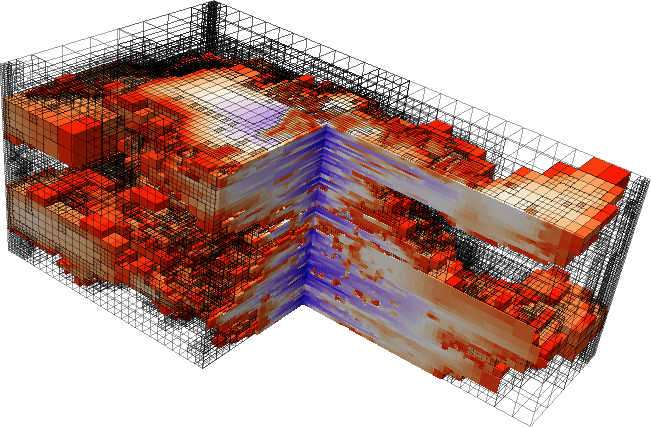
During the reaction of hydrogen and oxygen, water is produced. The produced water needs to be removed from the catalytic layer, where the reactions take place, to keep enough space available for new reactants. If there is not no exchange, an equilibrium evolves such that no electric energy is produced by the reactions. To ensure a continuous energy supply, the produced water is removed through the cathode of the cell. The water is transported through the different, porous layers. Water can be present in liquid or vapor form, due to condensation and evaporation. In this simulation, we consider the liquid water transport through the hydrophobic gas diffusion layer. This means, the water is the non-wetting phase on this coated carbon fiber material. On the pore-scale, this is an inhomogeneous and anisotropic structure. To investigate the water transport though this layer and to predict the break-through locations of the liquid water on the surface of the porous layer, a geometrical simplified model is used. The pore space of the material is represented by a network of pore bodies (network nodes) and pore throats (network connections). This allows an efficient calculation of the ongoing transport processes in the gas diffusion layer including the pore-scale effects. The simulation shows the locations, where liquid water first leaves the fibrous material. With this information, the gas diffusion layer structure can be optimized for the desired water distribution.
Skala 4: Eine einzelne Brennstoffzellen-Schicht
Credits: University of Stuttgart / SFB 1313
If we take a closer look at one of the nine layers under the microscope – the GDL layer – the network-like structure and cavities become visible. This layer is porous. Hydrogen, oxygen and water can flow through it.
This is the GDL layer, transferred into a computer model. Researchers are able to create simulations with the help of models. This simulation shows how and where exactly hydrogen, oxygen and water flow through the layer.
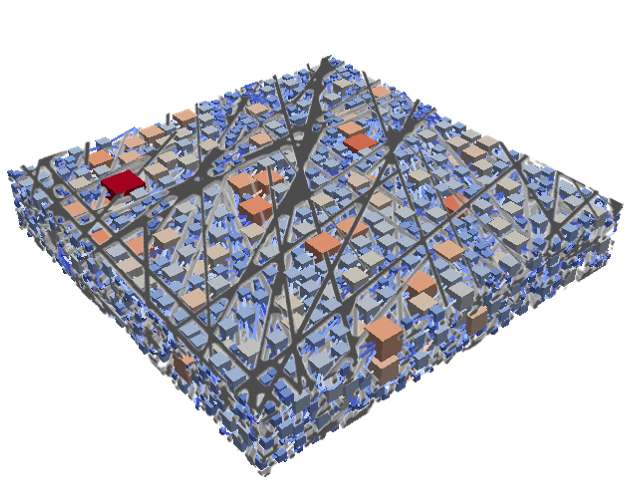
Credits: University of Stuttgart / SFB 1313 / Cynthia Michalkowski
InterPore
Many people worldwide work and research in the field of porous media, but how can all of the knowledge that they create be made accessible to others? This is where InterPore comes in.
InterPore is a nonprofit, independent scientific organization founded in 2008. It serves as a platform for interdisciplinary exchange and international cooperation between science and industry. InterPore bundles the worldwide collected knowledge of porous media into one network and brings together the people who work and research in this area.
Goal
Knowledge about porous media in various areas can be easily shared through the network and furthers research. InterPore members are made aware of the work of their colleagues, they can exchange ideas with each other and, based on existing knowledge, develop new concepts and models that advance research in the field of porous media so that the wheel does not always have to be reinvented.
Pretty Porous
How data becomes images
Making the hidden visible: How data becomes images
University of Stuttgart / VISUS
The results of computer simulations are data sets. More and more details, larger systems and longer periods of time are what experts from numerous disciplines want to look at in order to gain new insights. Finding answers in this flood of data increasingly resembles searching for the proverbial “needle in a haystack”. Pictures or graphics of the abstract information are essential for this. They make visible what would otherwise remain hidden from the human eye.
The weather map in the evening, car navigation or the election results of the current federal election – in our everyday lives, images often show us what has been compiled in elaborate measurements, extensive data collections or complicated calculations. Scientists and developers are no different. Complex information or processes are most easily examined in graphical representations. But what has to happen so that the weather map flickers across the screen or an engineer can examine his idea on the computer?
Thanks to visualization, data sets generated in computer simulations are converted into visual images. This makes the seemingly unmanageable information interpretable and analyzable.
Visualizations are mostly interactive and three-dimensional. They can be viewed from all sides, individual parameters can be shown or hidden and special features can be highlighted. The display on high-resolution large projection screens also provides a comprehensive impression of all details. With interactive real-time graphics, conceptual considerations and possible implementation variants can be experienced at an early stage.
University of Stuttgart / VISUS
University of Stuttgart / VISUS