What is visualization? making hidden things visible
Computer simulations result in enormous amounts of data. Finding answers is like searching for the proverbial “needle in a haystack”. Pictures or graphics are essential here. They make visible what would be otherwise remain hidden from the eye.
„Today we have a constantly increasing flood of data. Even their calculation and storage is very complex. Therefore, the data must be prepared accordingly. This is where visualization comes in.” – Prof. Thomas Ertl, Head of the Visualization Institute and Spokesperson of the Cluster of Excellence EXC 2075 “Data-Integrated Simulation Science” at the University of Stuttgart.

University of Stuttgart / VISUS
University of Stuttgart / VISUS / SFB 716
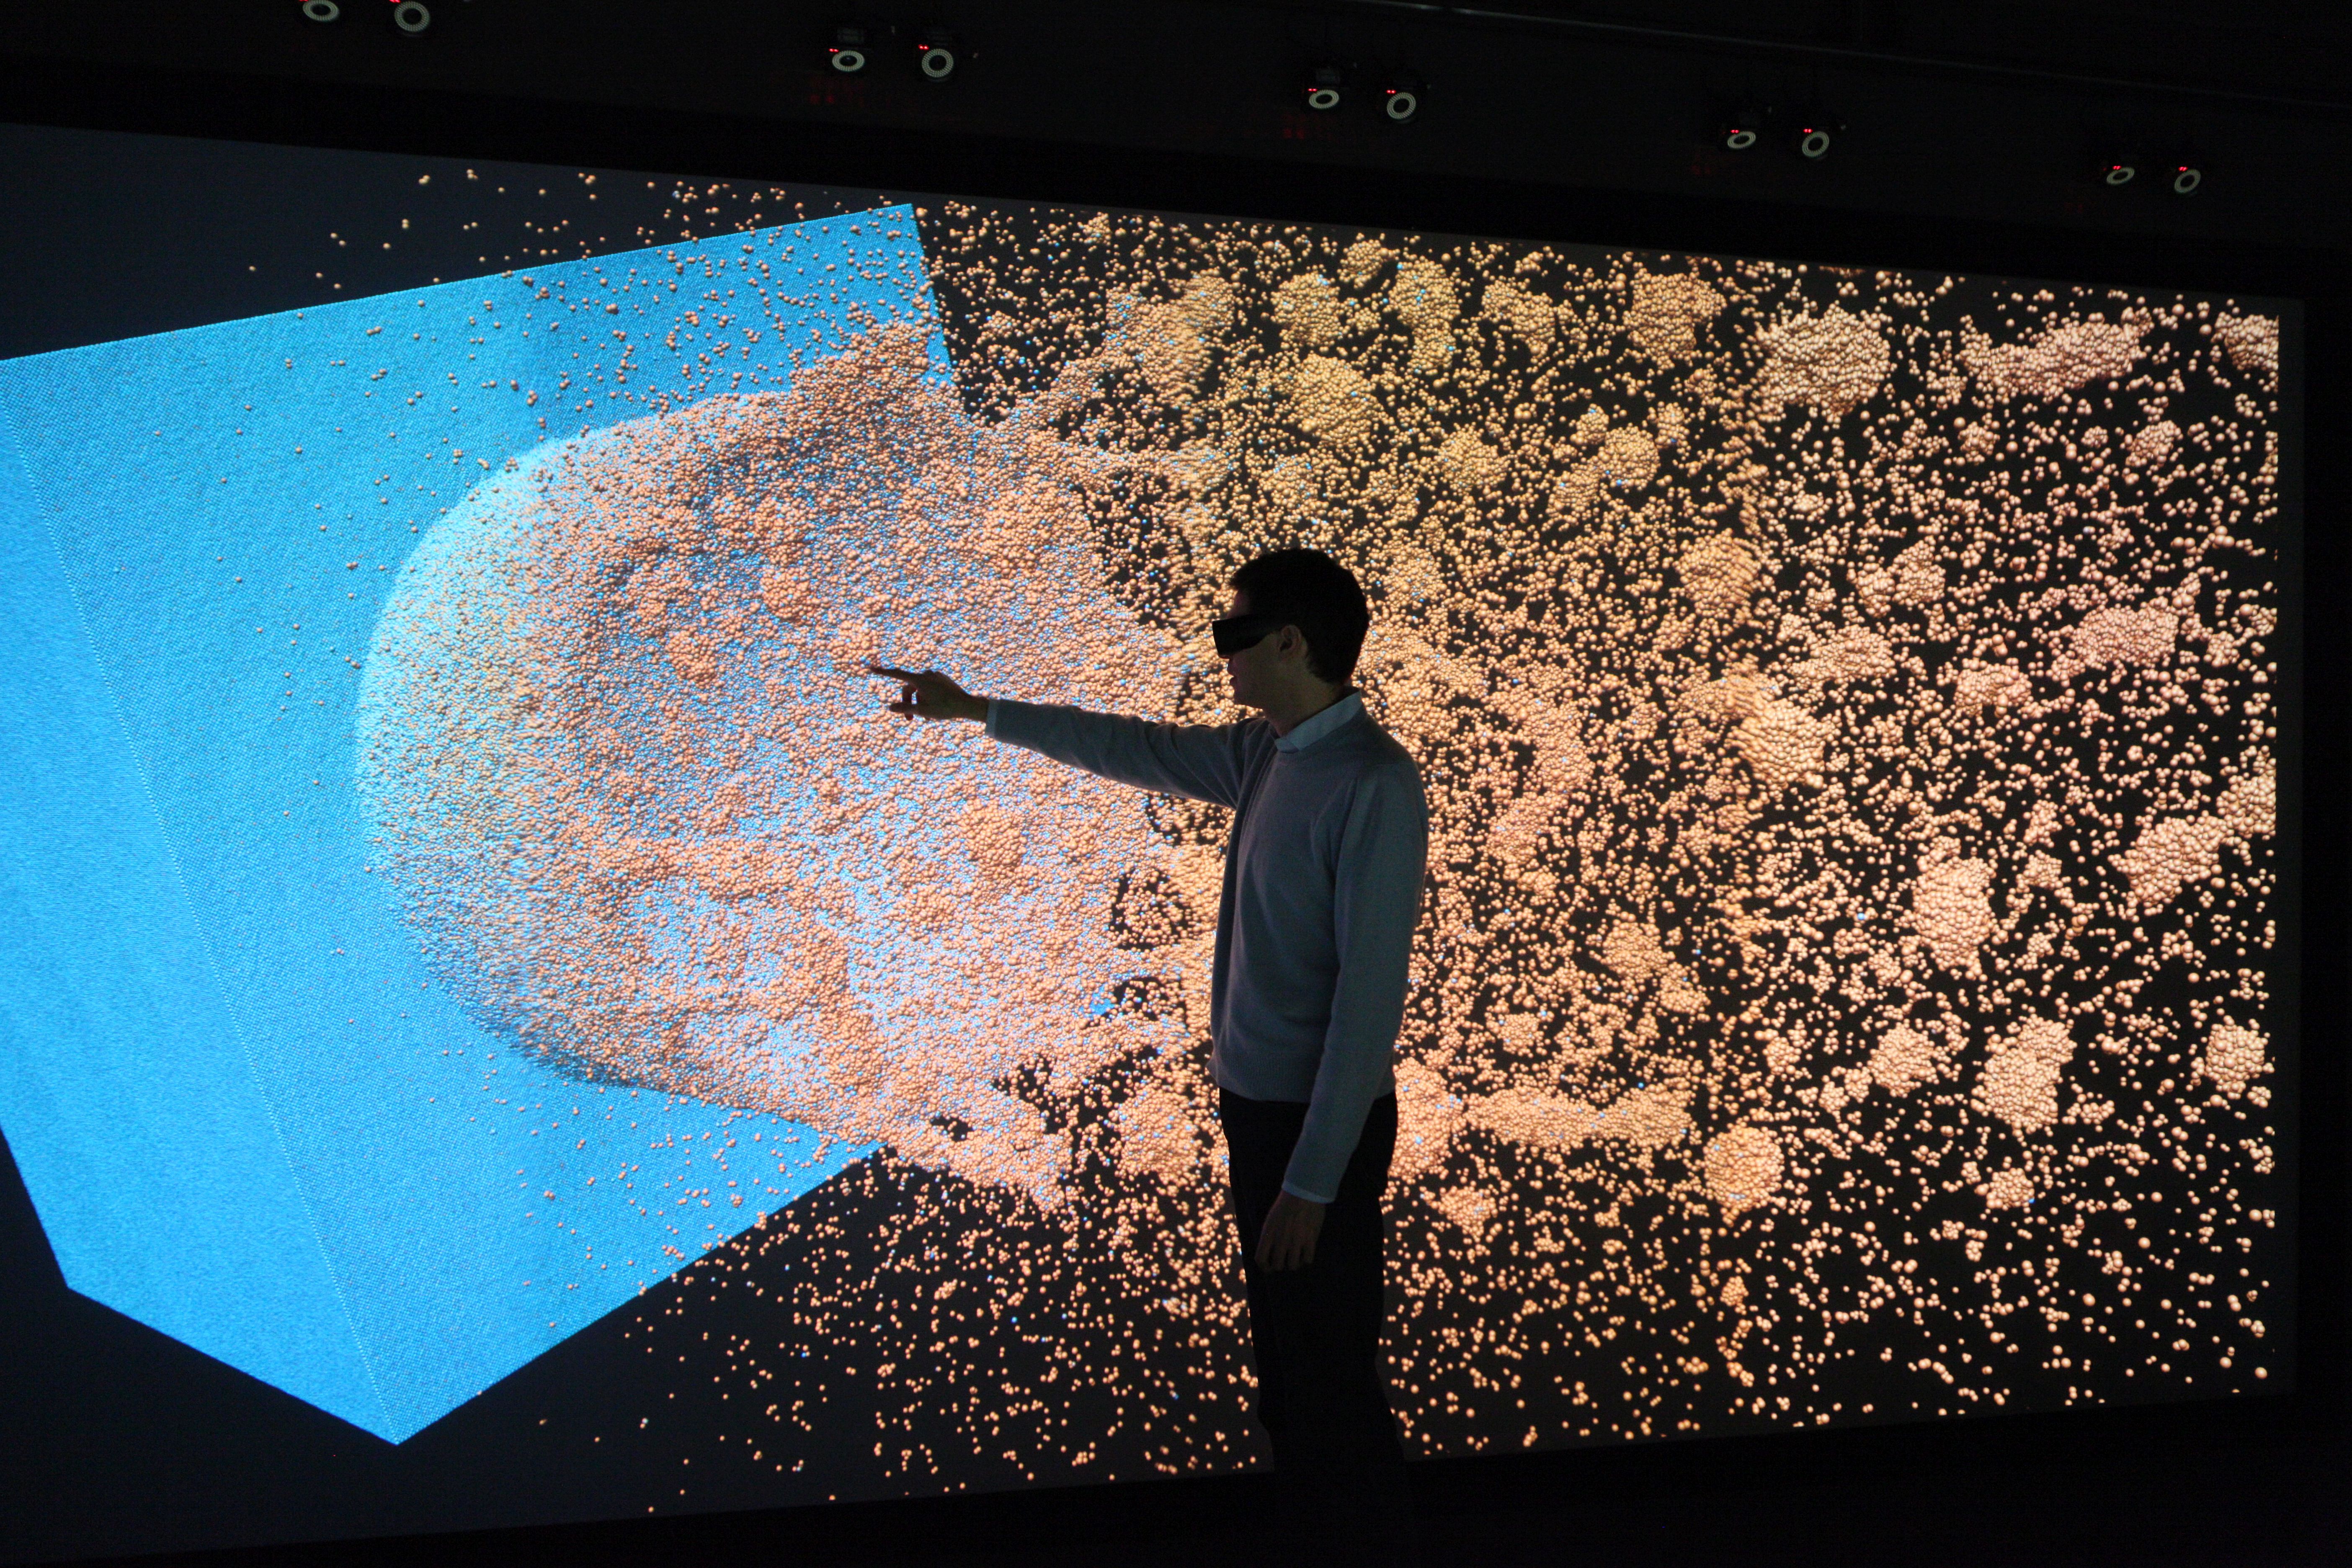
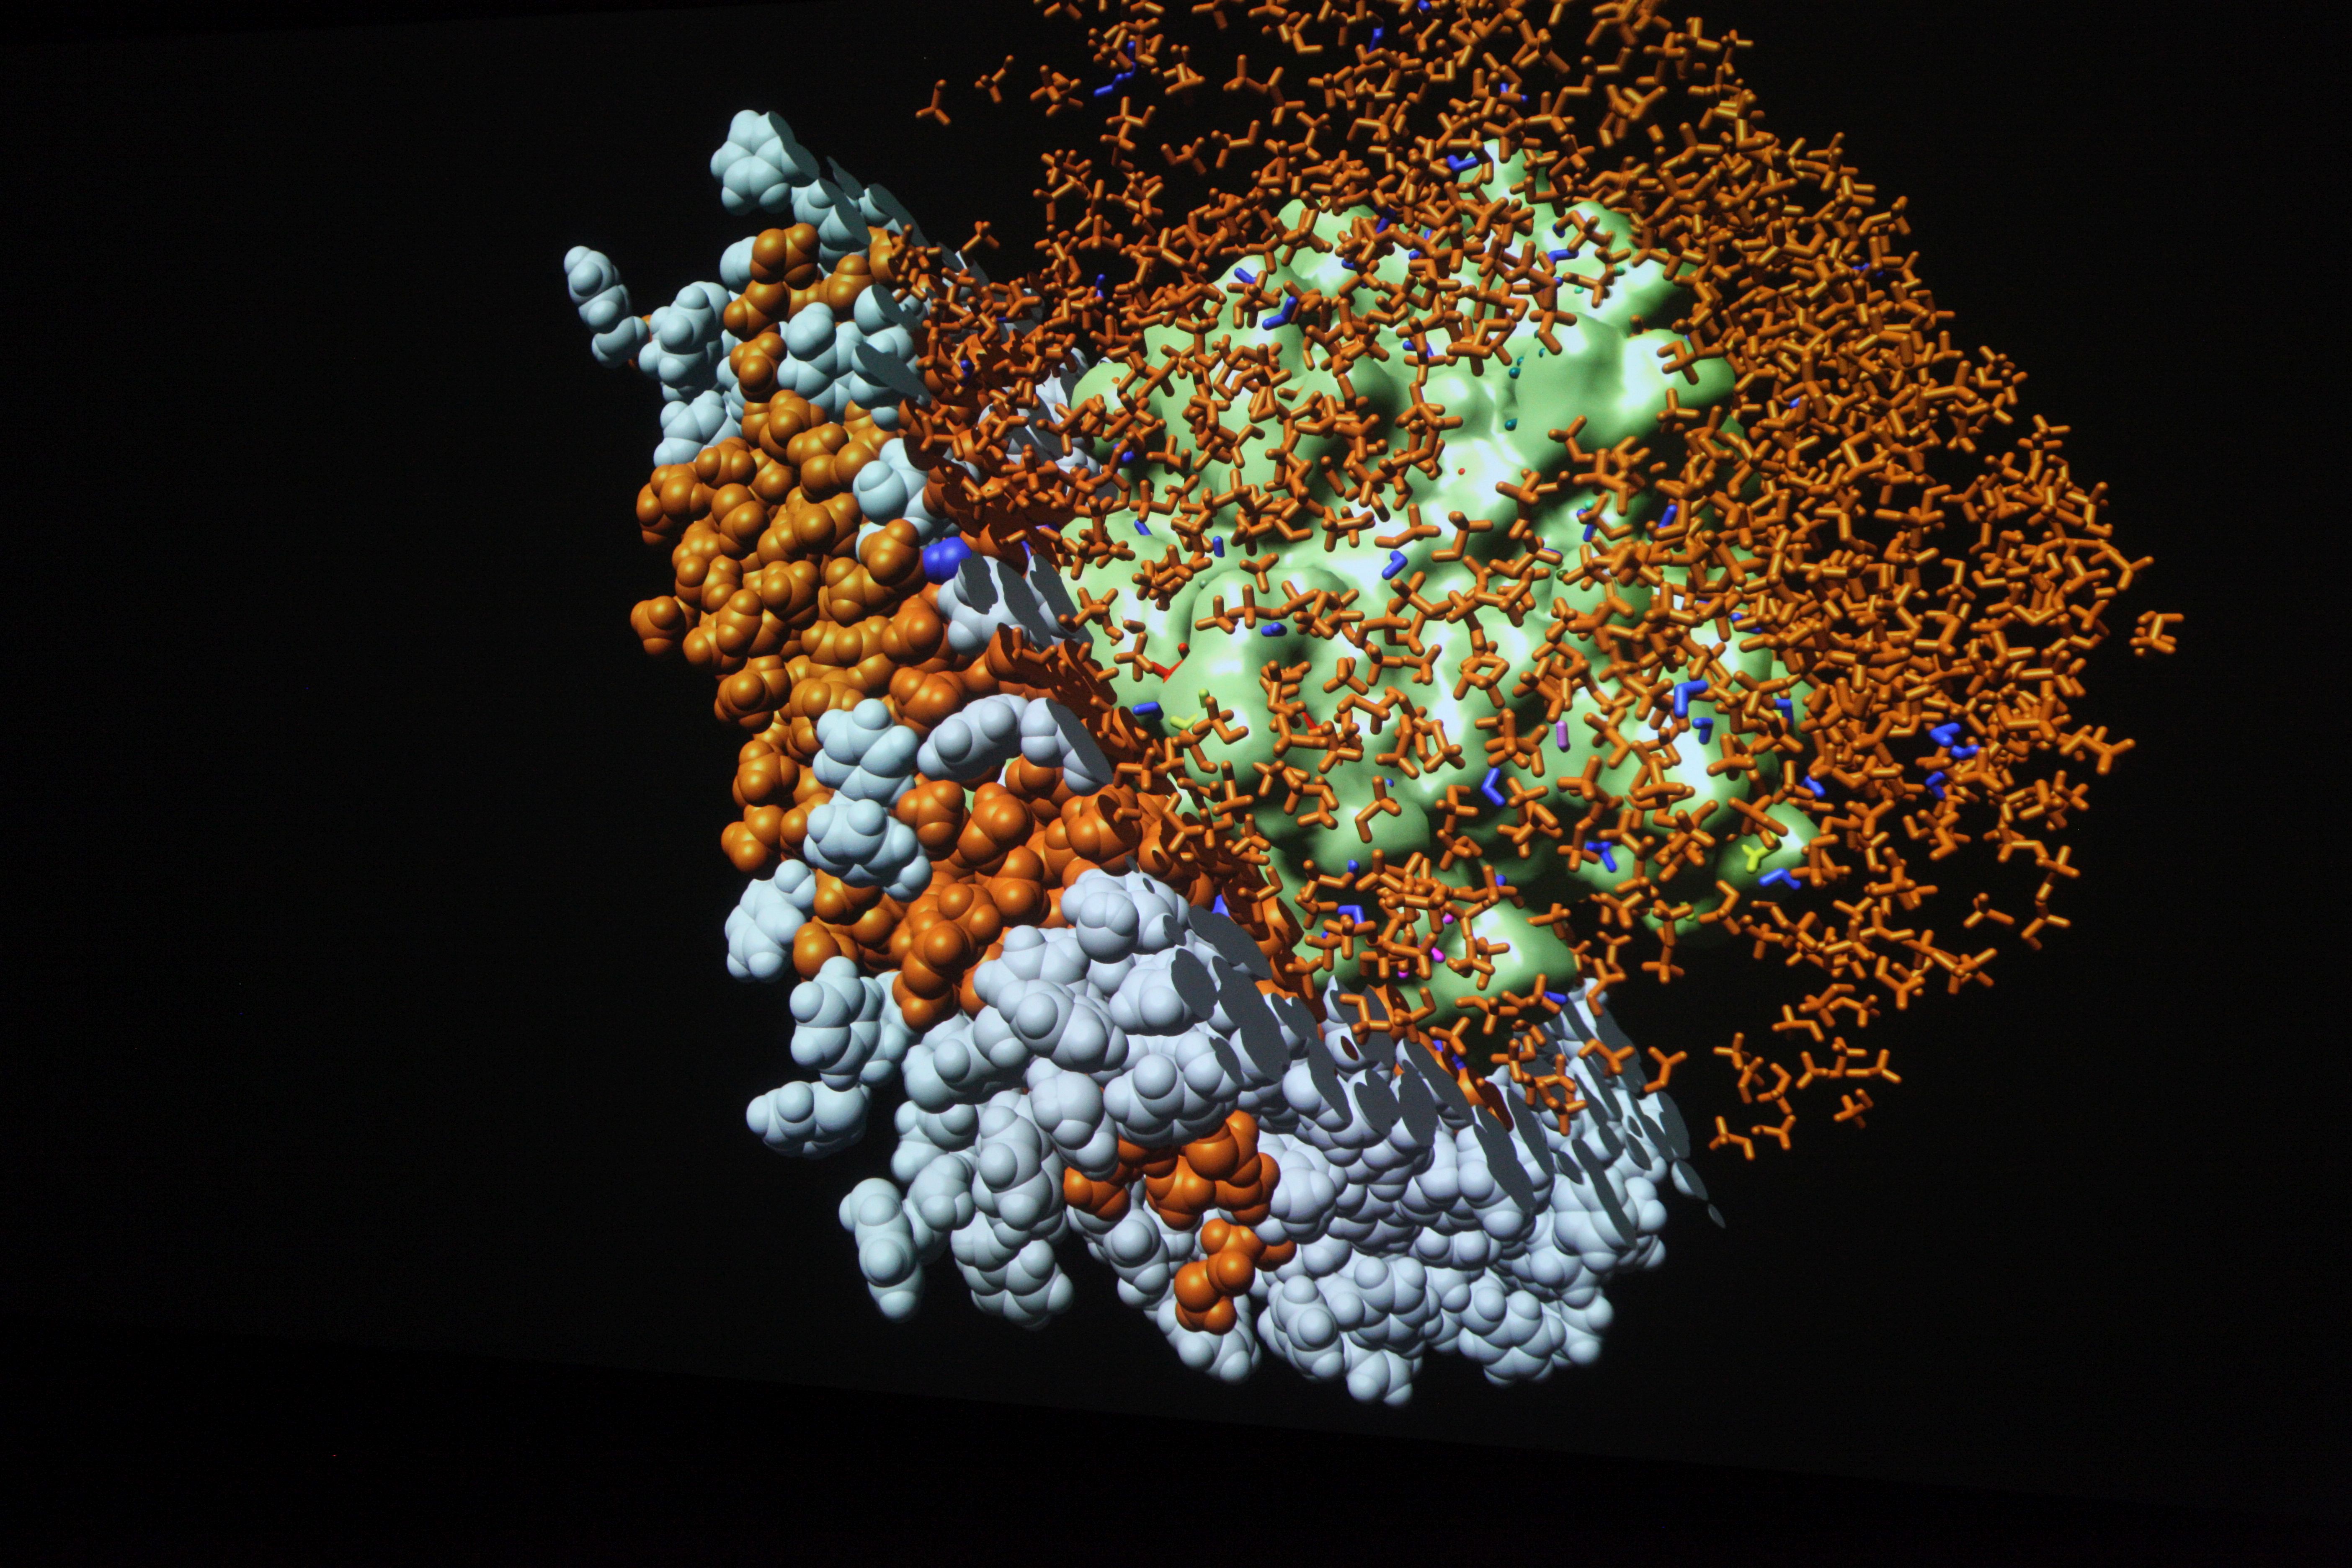
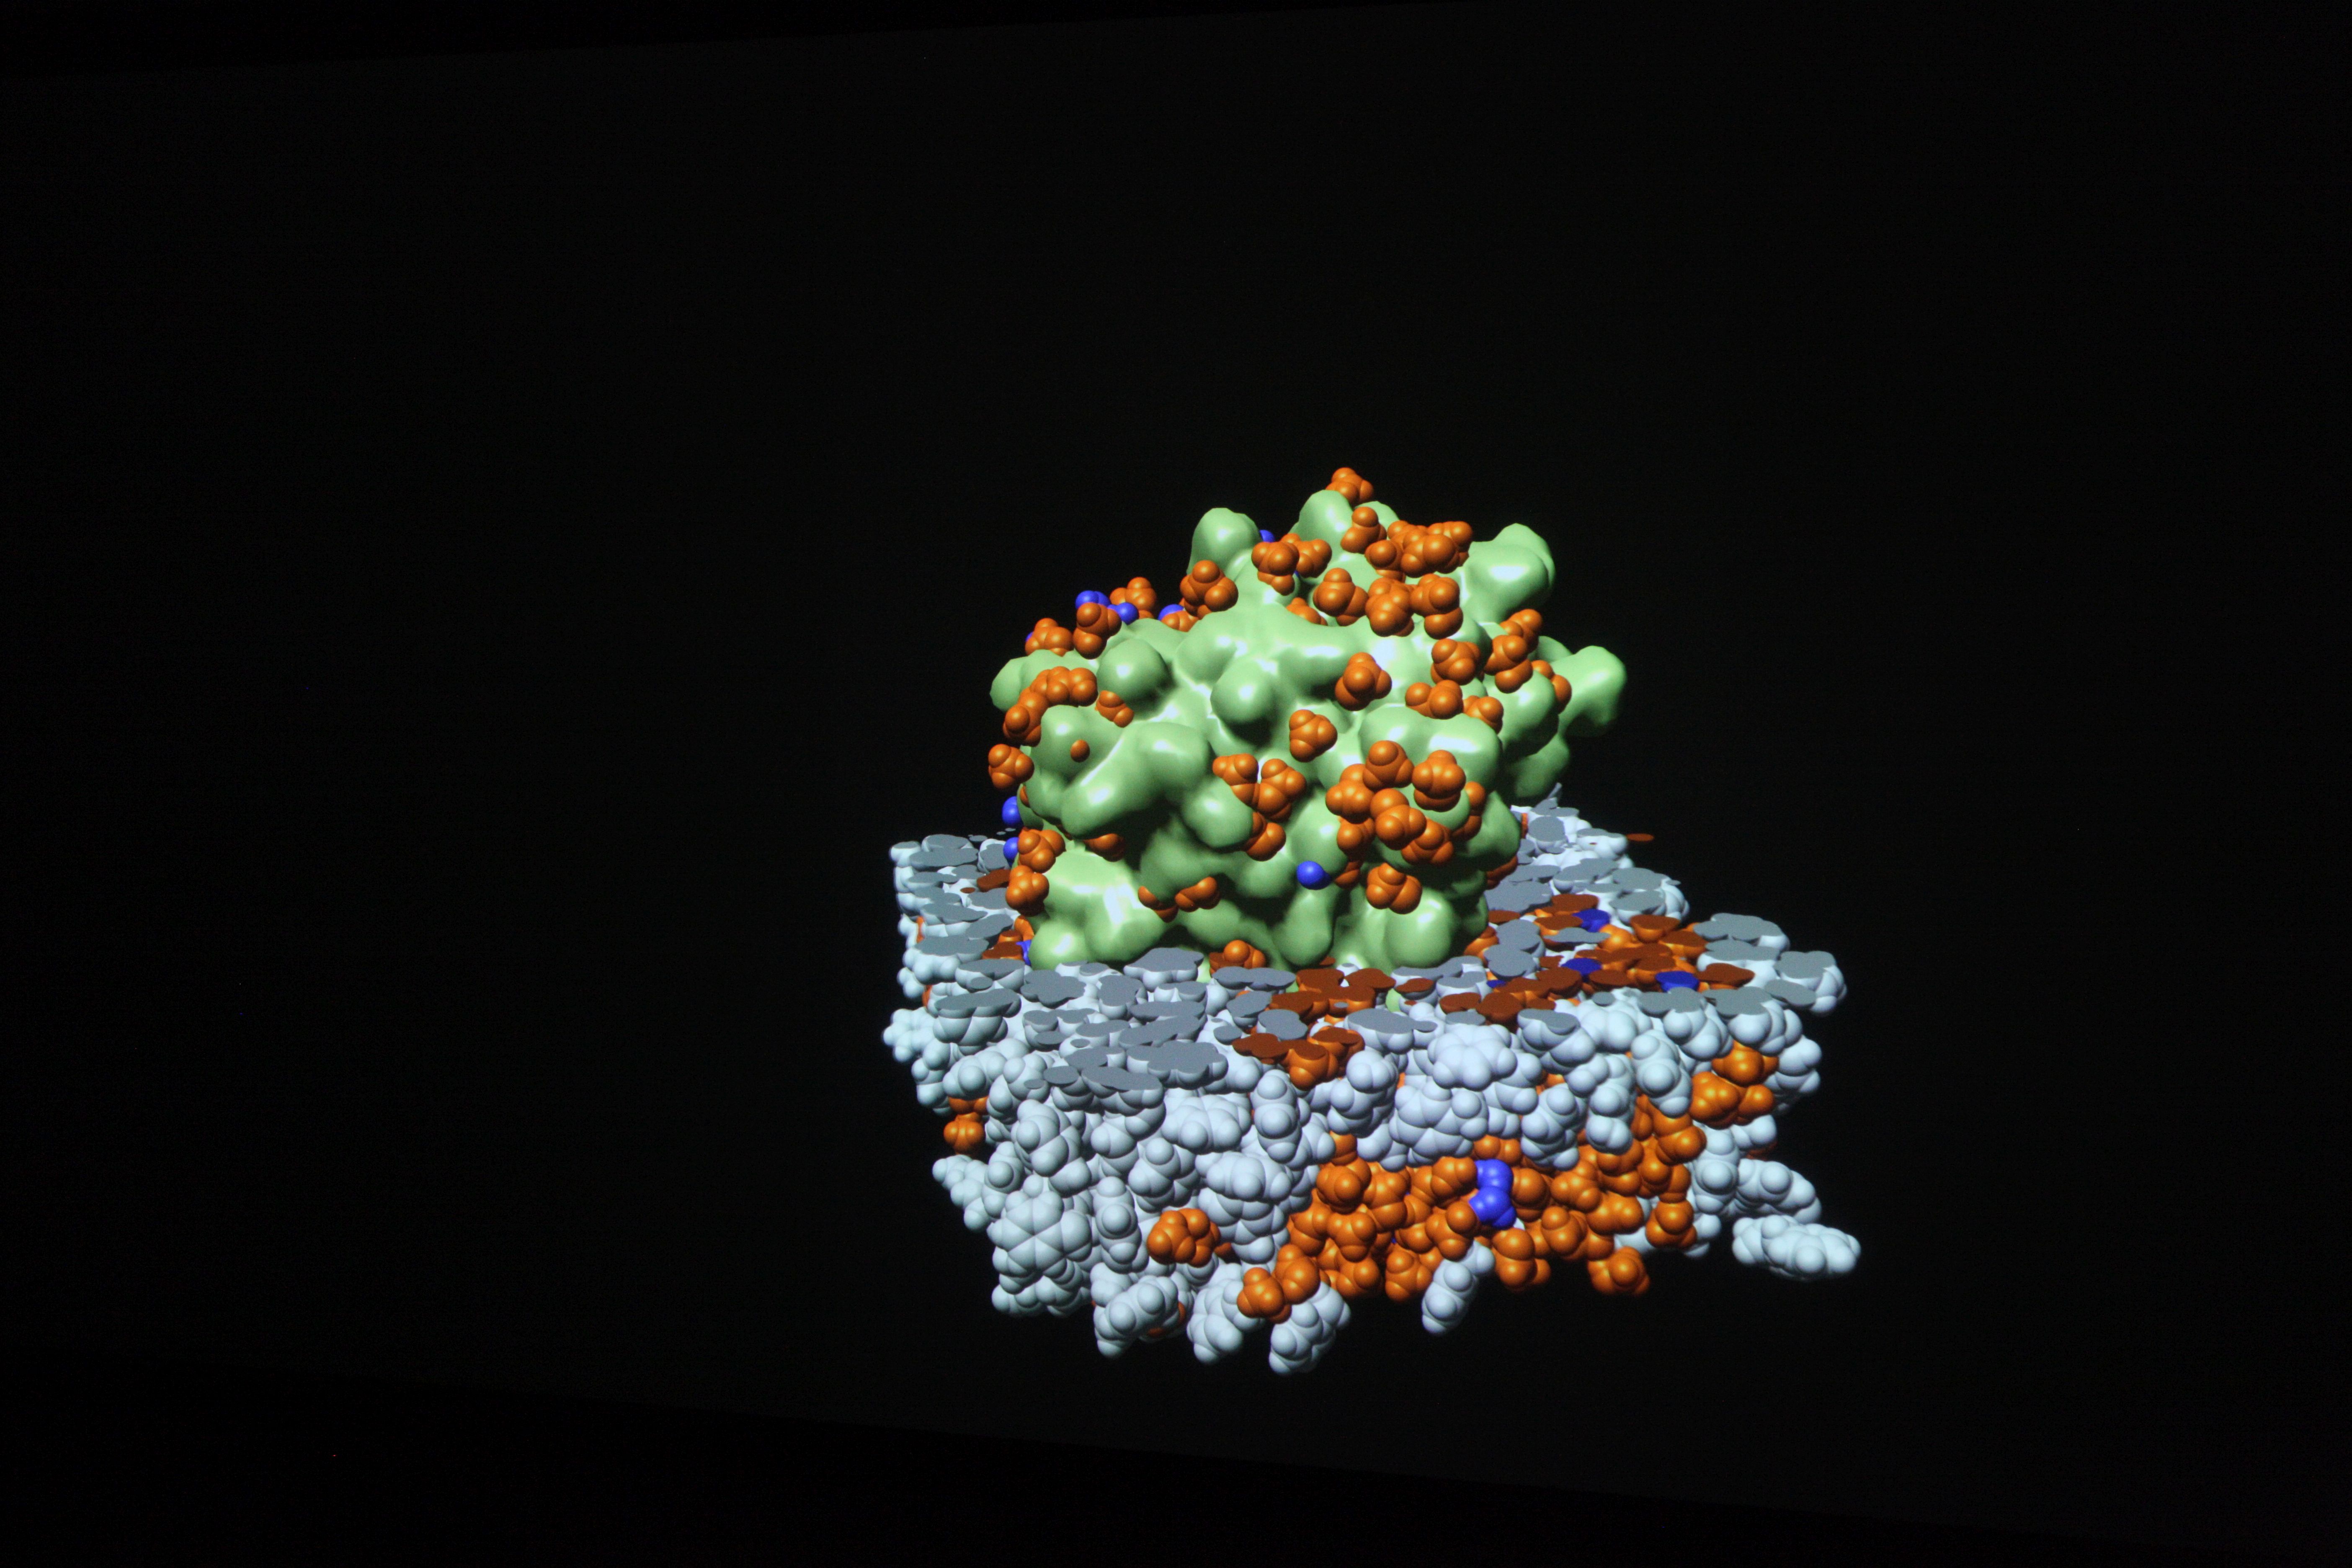
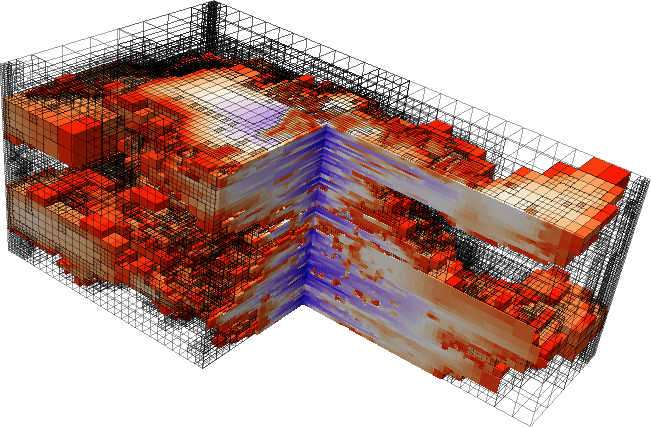
Visualizations transform the data from computer simulations into graphic representations. Scientists can often use these images to interpret the information in the data more easily. Scientific visualizations are usually three-dimensional and interactive, which means that they can be viewed from all sides.
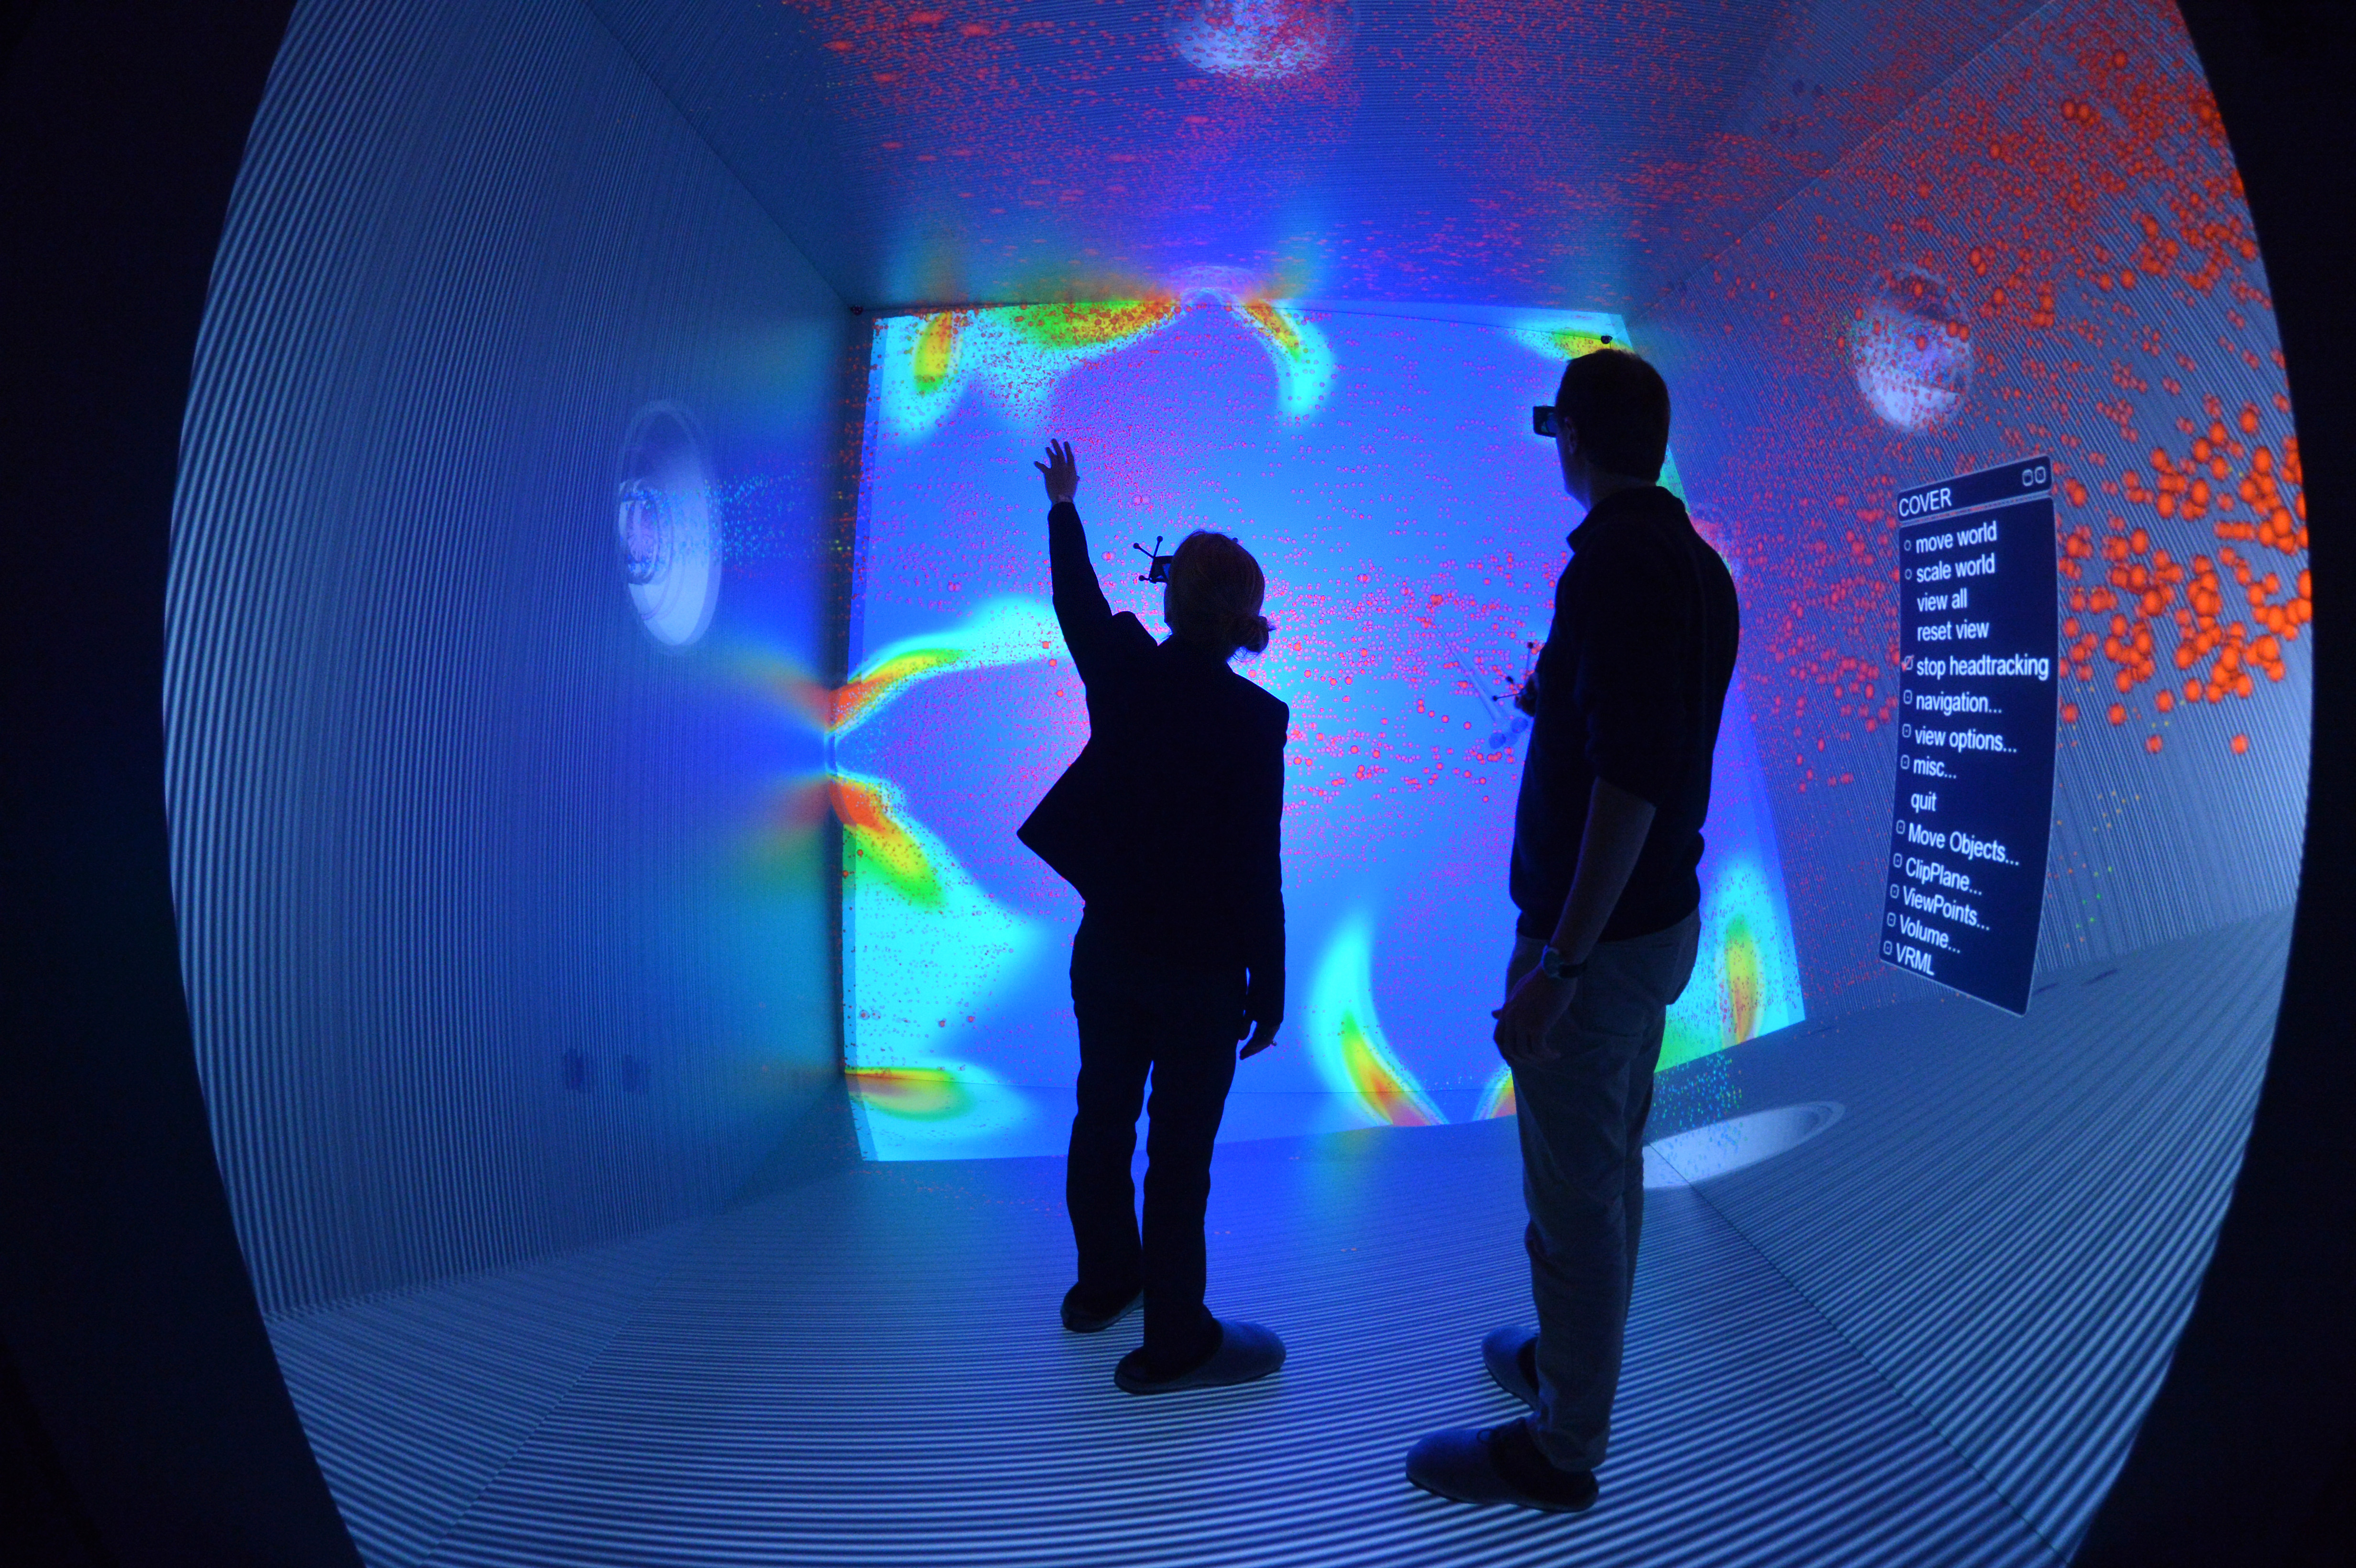
Visualizations on high-resolution large projection screens make even the smallest details visible, which would hardly be visible on normal screens. The size of the screen also makes it easier for the scientists to analyze the data together.
University of Stuttgart / VISUS
University of Stuttgart / VISUS

University of Stuttgart / VISUS
University of Stuttgart / David Ausserhofer
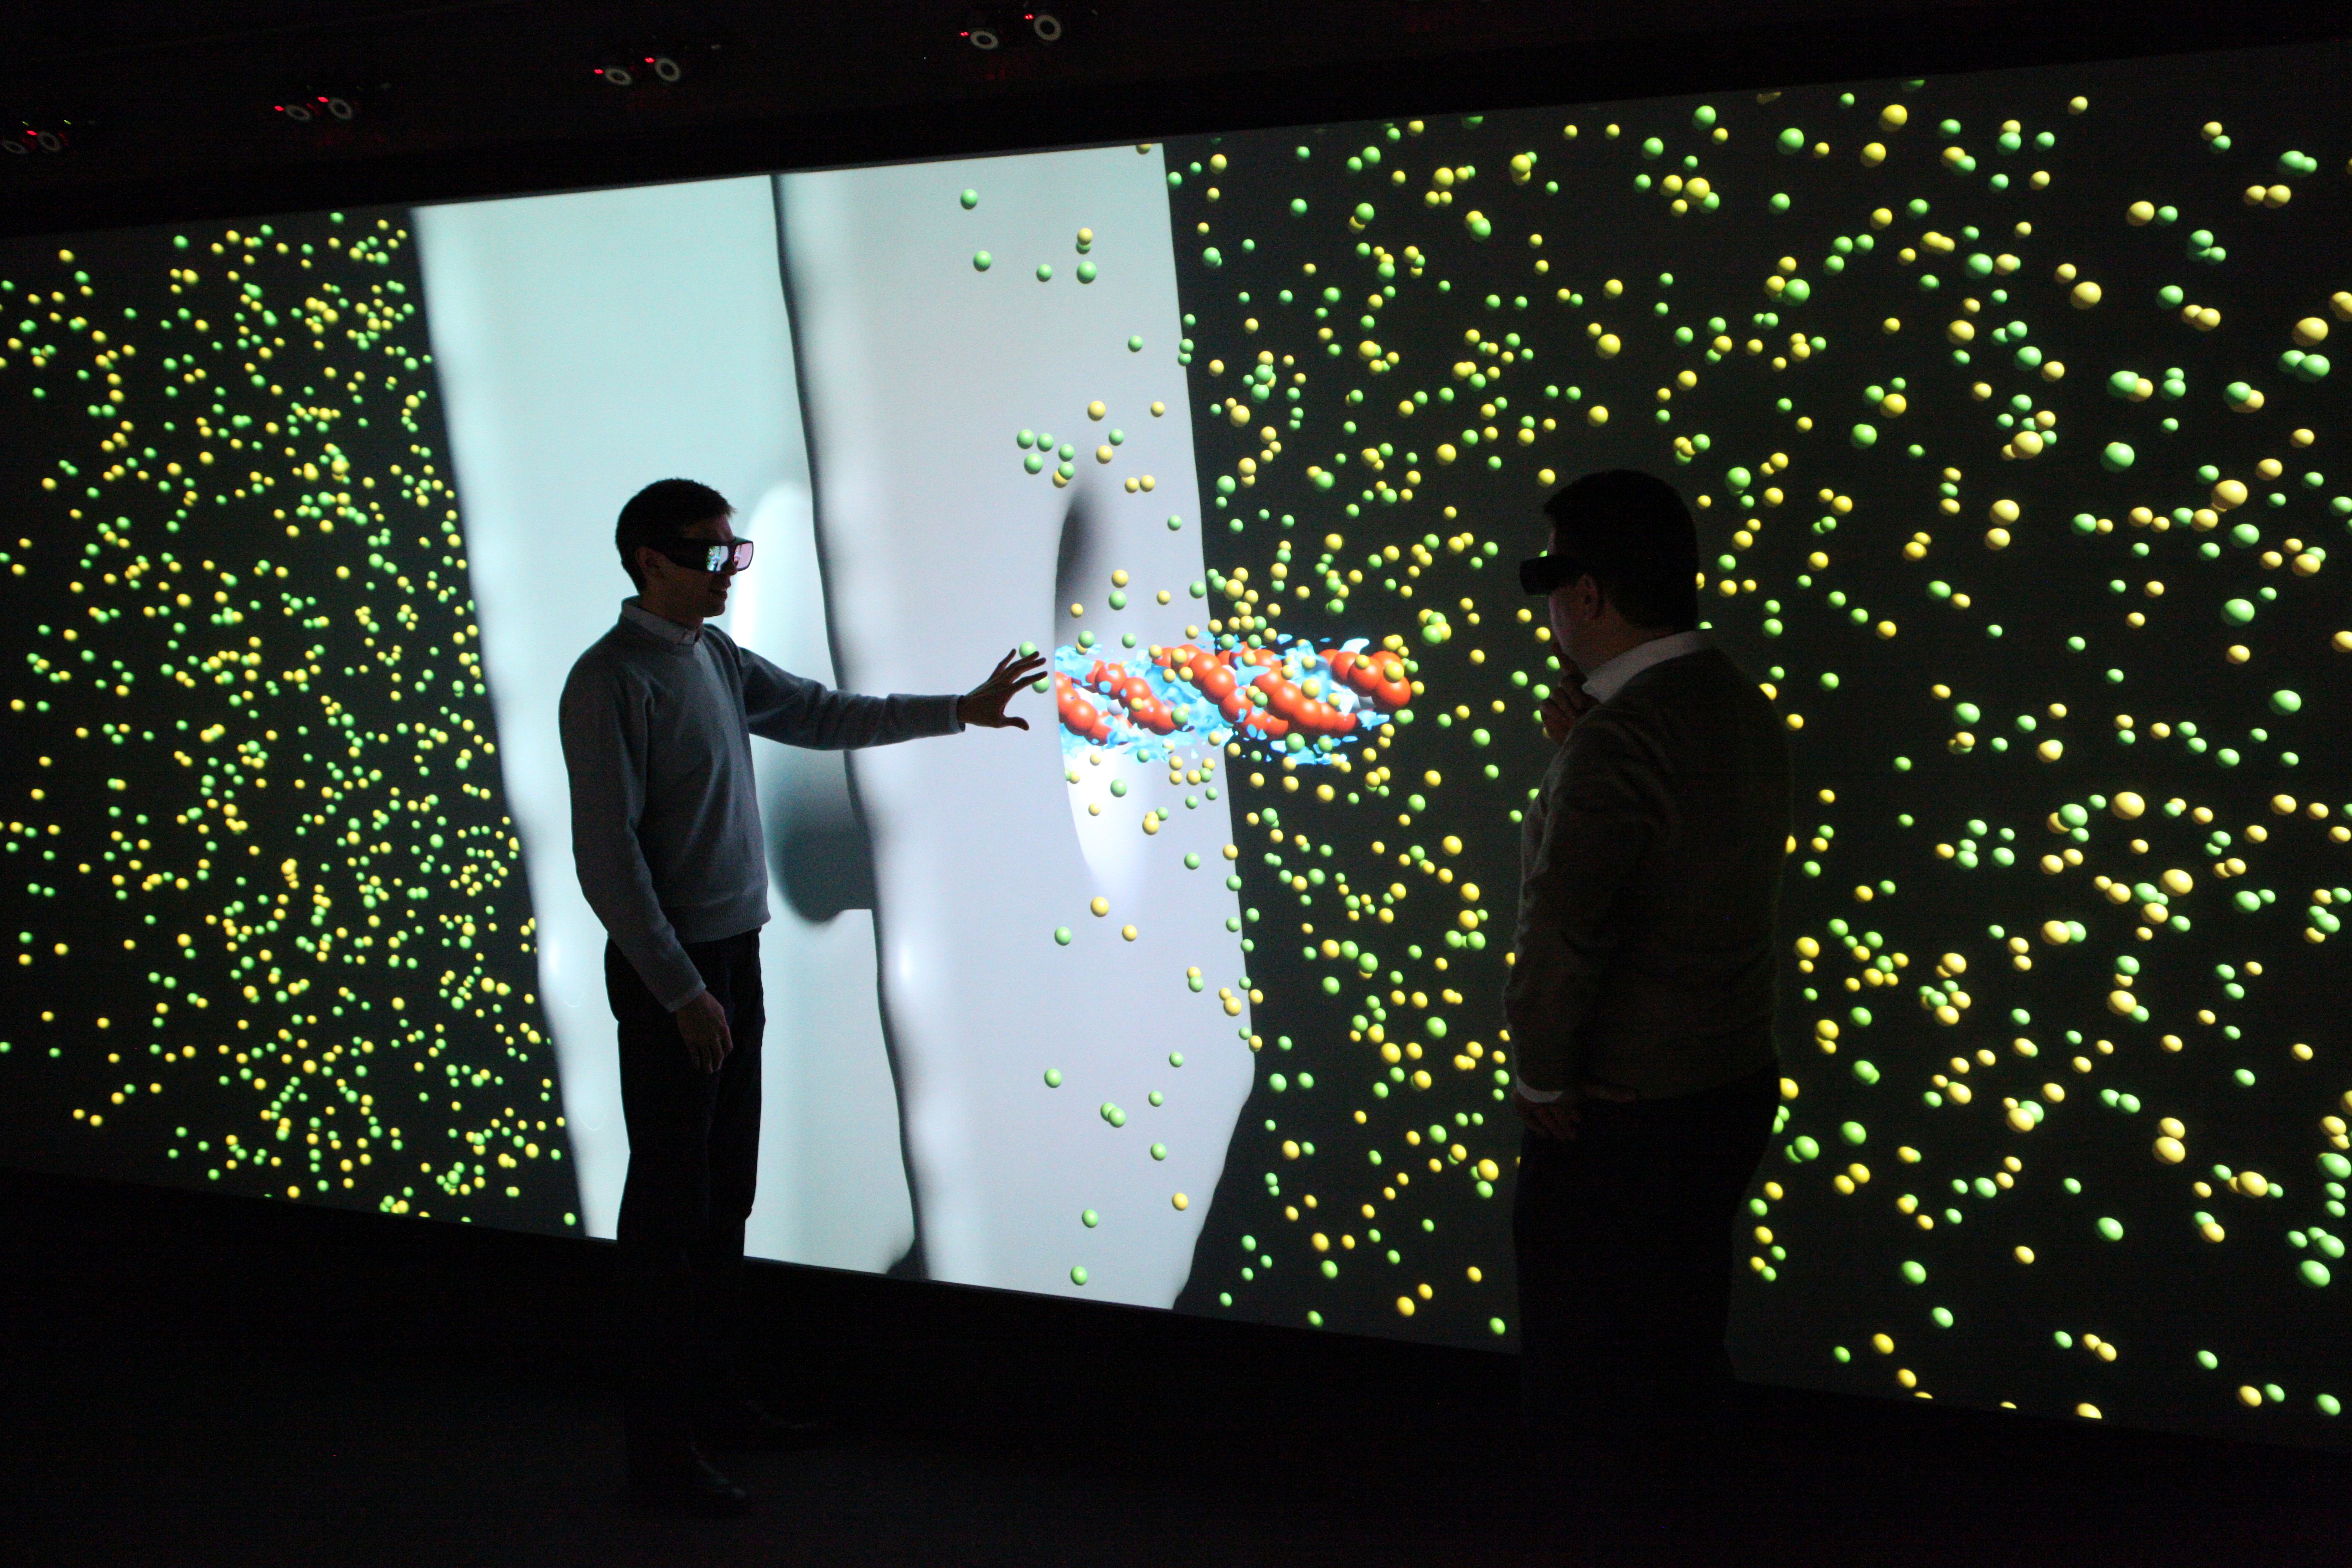
University of Stuttgart / VISUS / SFB 716
Making the hidden visible: How data becomes images
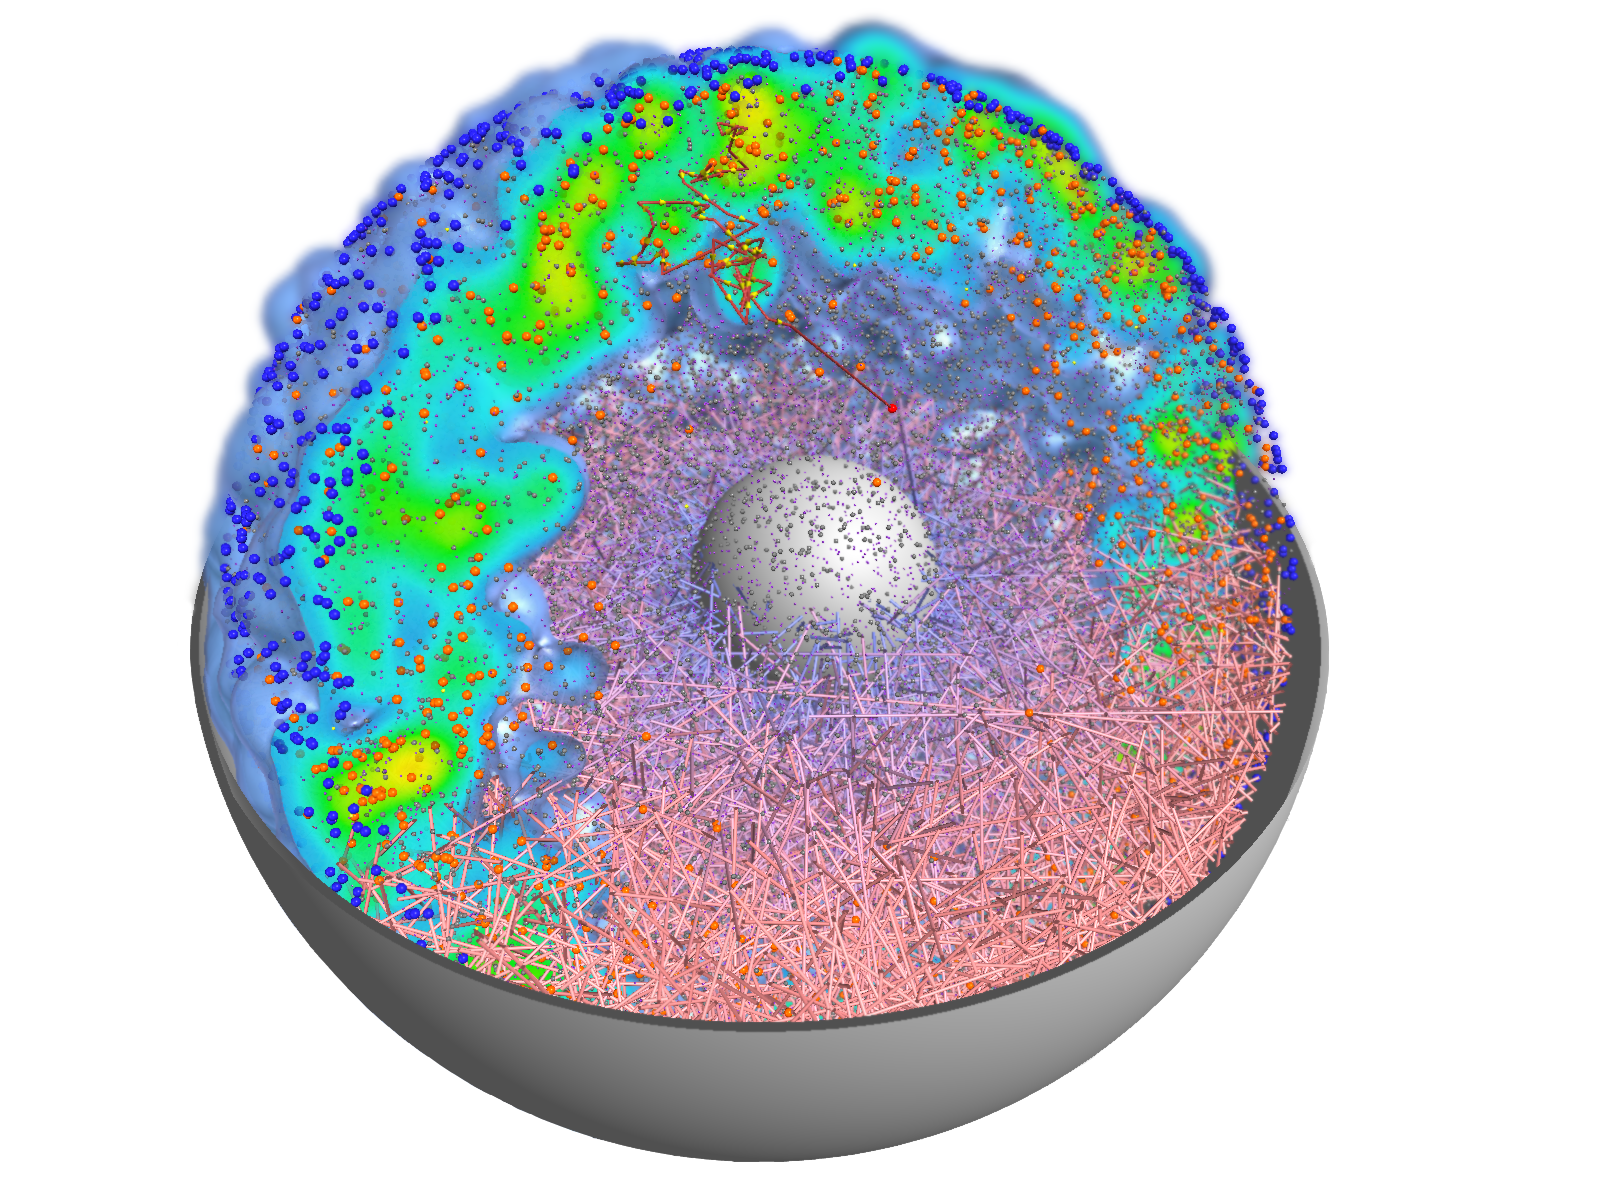
University of Stuttgart / VISUS
The results of computer simulations are data sets. More and more details, larger systems and longer periods of time are what experts from numerous disciplines want to look at in order to gain new insights. Finding answers in this flood of data increasingly resembles searching for the proverbial “needle in a haystack”. Pictures or graphics of the abstract information are essential for this. They make visible what would otherwise remain hidden from the human eye.
The weather map in the evening, car navigation or the election results of the current federal election – in our everyday lives, images often show us what has been compiled in elaborate measurements, extensive data collections or complicated calculations. Scientists and developers are no different. Complex information or processes are most easily examined in graphical representations. But what has to happen so that the weather map flickers across the screen or an engineer can examine his idea on the computer?
Thanks to visualization, data sets generated in computer simulations are converted into visual images. This makes the seemingly unmanageable information interpretable and analyzable.
Visualizations are mostly interactive and three-dimensional. They can be viewed from all sides, individual parameters can be shown or hidden and special features can be highlighted. The display on high-resolution large projection screens also provides a comprehensive impression of all details. With interactive real-time graphics, conceptual considerations and possible implementation variants can be experienced at an early stage.
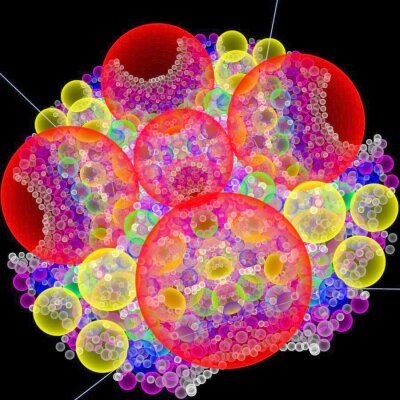
University of Stuttgart / VISUS
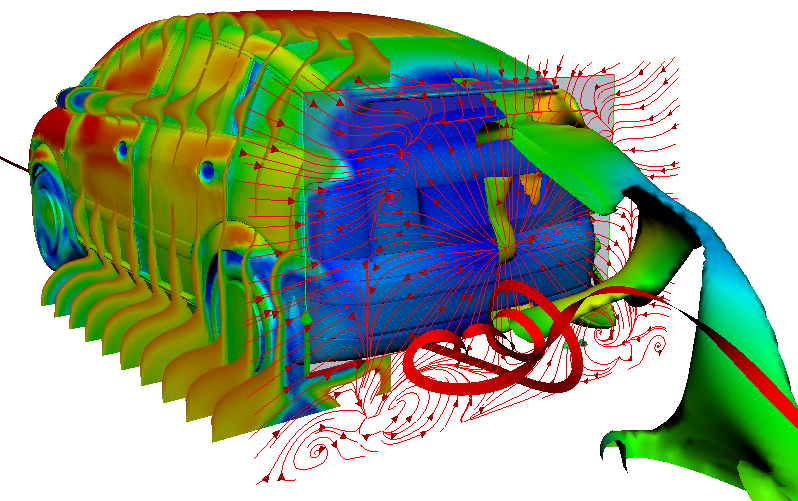
University of Stuttgart / VISUS
Step by step – the visualization process
01 Raw data
At the beginning of the visualization process there is an abstract, unmanageable amount of numbers – the data. Not all information can always be represented graphically. This is why scientists determine what is important to answer a question. This means that the data is filtered so that only those parts relevant to the analysis are visualized.
02 Mapping
For the filtered data it is now defined how they are graphically displayed. For example, atoms are usually visualized as spheres.
03 Rendering
The graphical representation of the previously selected representations is calculated. In addition, the angle from which the data is to be displayed is determined.
04 Finale Visualisierung
The result is a three-dimensional, interactive image that can be used to analyze the information selected in the first step.
Pretty Porous
01
01
Visualization
Visualizations transform data from computer simulations into graphic representations. Using these images, the information from the simulations can be interpreted and analyzed easier. Visualizations illustrate the simulation results.
What is a model? What is a simulation?
Simulations are created on the basis of models. In this way, different scenarios can be simulated which are too expensive or too dangerous in reality or which are not visible to the naked eye. Simulations make the invisible visible.
Example from the field of biology:
Model: Virtual reproduction of the human brain
Simulation: How does the brain behave when taking certain medication? In this way, the transport of medications can be made visible.
Simulations make processes visible.
Vivid examples can be found in the simulation gallery.